Chinese Academy of Sciences
The South China Sea is where most tropical cyclones (TCs) attack the Chinese mainland, but the lack of observational data has for decades hindered our ability to forecast them.
In August 2022, a field campaign during TC Mulan boosted confidence in forecasting similar events in the future. The results of the campaign were recorded and published in Advances in Atmospheric Sciences on Nov. 1.
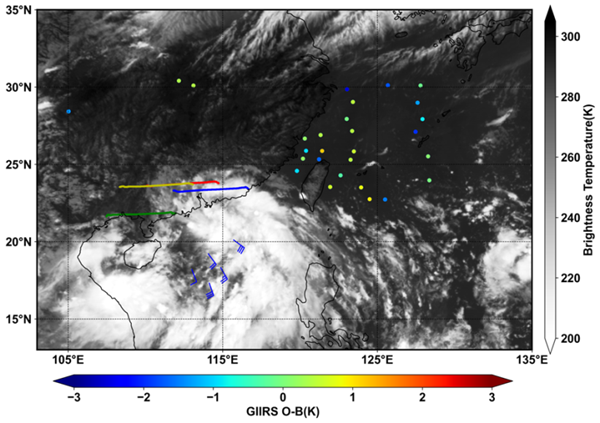
The campaign, starting on August 5, collected observations simultaneously using China's FengYun-4B geostationary satellite, aircraft equipped with dropsondes (weather devices designed to be dropped from aircraft at specified altitudes), and balloons equipped with radiosondes (a small instrument suspended below the balloon).
The project was a collaboration between the China Meteorological Administration (CMA), Institute of Atmospheric Physics of the Chinese Academy of Sciences (IAP/CAS), Fudan University, and the Hong Kong Observatory (HKO).
"We at HKO were honored to have the chance to collaborate with the CMA and other scientific institutes on the Chinese mainland for this project," said Pak-Wai CHAN from HKO. "This joint effort is a landmark in enhanced meteorological observations over the South China Sea."
"We were excited to find that the enhanced observational data displayed positive impacts on both the track and intensity forecasts of TC Mulan," said Prof. HAN Wei from the Earth System Modeling and Prediction Centre at the CMA. "Moreover, rainfall forecasts along the South China coast were more accurate with these data."
These results confirm the findings of the team's previous research, in which dropsonde data were used to observe four TC cases in 2020.
"We hope to conduct more such field campaigns in the future to collect evermore useful observations of TCs. Not only operational forecasting but also basic scientific research will benefit greatly from these data," concluded Dr. QIN Xiaohao from IAP/CAS.
/Public Release. This material from the originating organization/author(s) might be of the point-in-time nature, and edited for clarity, style and length. Mirage.News does not take institutional positions or sides, and all views, positions, and conclusions expressed herein are solely those of the author(s).View in full here.


