
Experts from the Center for Energy Studies (CES) at Rice University's Baker Institute for Public Policy have created an interactive mapping tool of all U.S. data centers and their infrastructure. By bringing together infrastructure, market, environmental, social and political data, this platform provides a comprehensive view of the factors influencing data center siting decisions.
The U.S. Data Centers and Infrastructure map was developed by Kenneth B. Medlock III, Miaomiao Rimmer, Anmol Mital and Beck Edwards.
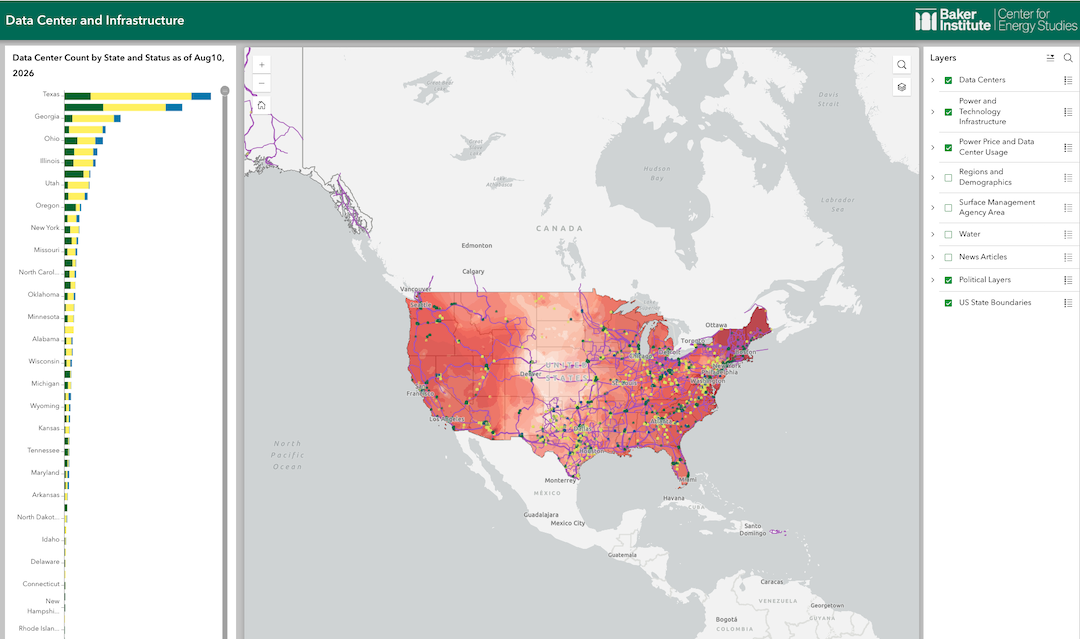
"We will be updating this in real-time," said Medlock, the senior director of CES. "It includes all data centers that exist or have been proposed in the country. The map lets you see why data centers are being built where they are by connecting the dots between infrastructure, power costs, water availability, public policy and public sentiment across different regions. You can zoom out and look at the whole U.S. to easily realize why data centers locations are being chosen - the price of power and water matters."
The map integrates the locations of data centers with key legacy infrastructure, including fiber-optic networks, electric transmission lines and power plants. It also incorporates information on water stress, wholesale electricity prices and natural gas prices.
In addition, the platform includes county-level analyses of news coverage and media headquarters to examine local sentiment toward data center development, along with U.S. political and demographic data. Users can explore the map by turning layers on and off and accessing detailed, facility-level information through interactive pop-ups.
Other interactive maps developed by CES include Energy Infrastructure and Politics in Europe, China Energy Map, Energy Infrastructure and Politics in North America and Energy Infrastructure and Politics in South America. Learn more about the research at CES.


