Researchers at the John Innes Centre and the Earlham Institute are pioneering powerful single-cell visualisation techniques that could unlock higher yields of global wheat.
Firmly in their sights is the longstanding question that has perplexed the wheat research community: Why do grains at the bottom of the spike fail to achieve full size compared to those higher up?
Previous studies have analysed wheat tissue in bulk (taking dissected tissue pieces in their entirety), limiting image resolution, and increasing the likelihood of unclear results.
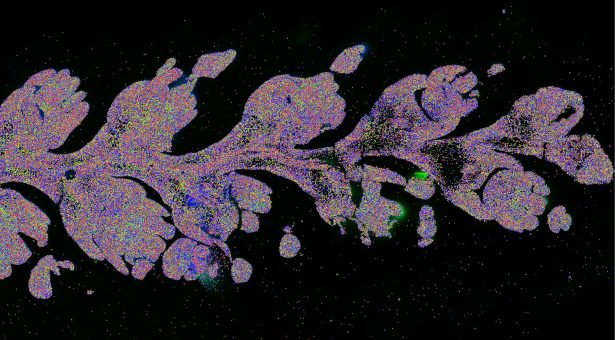
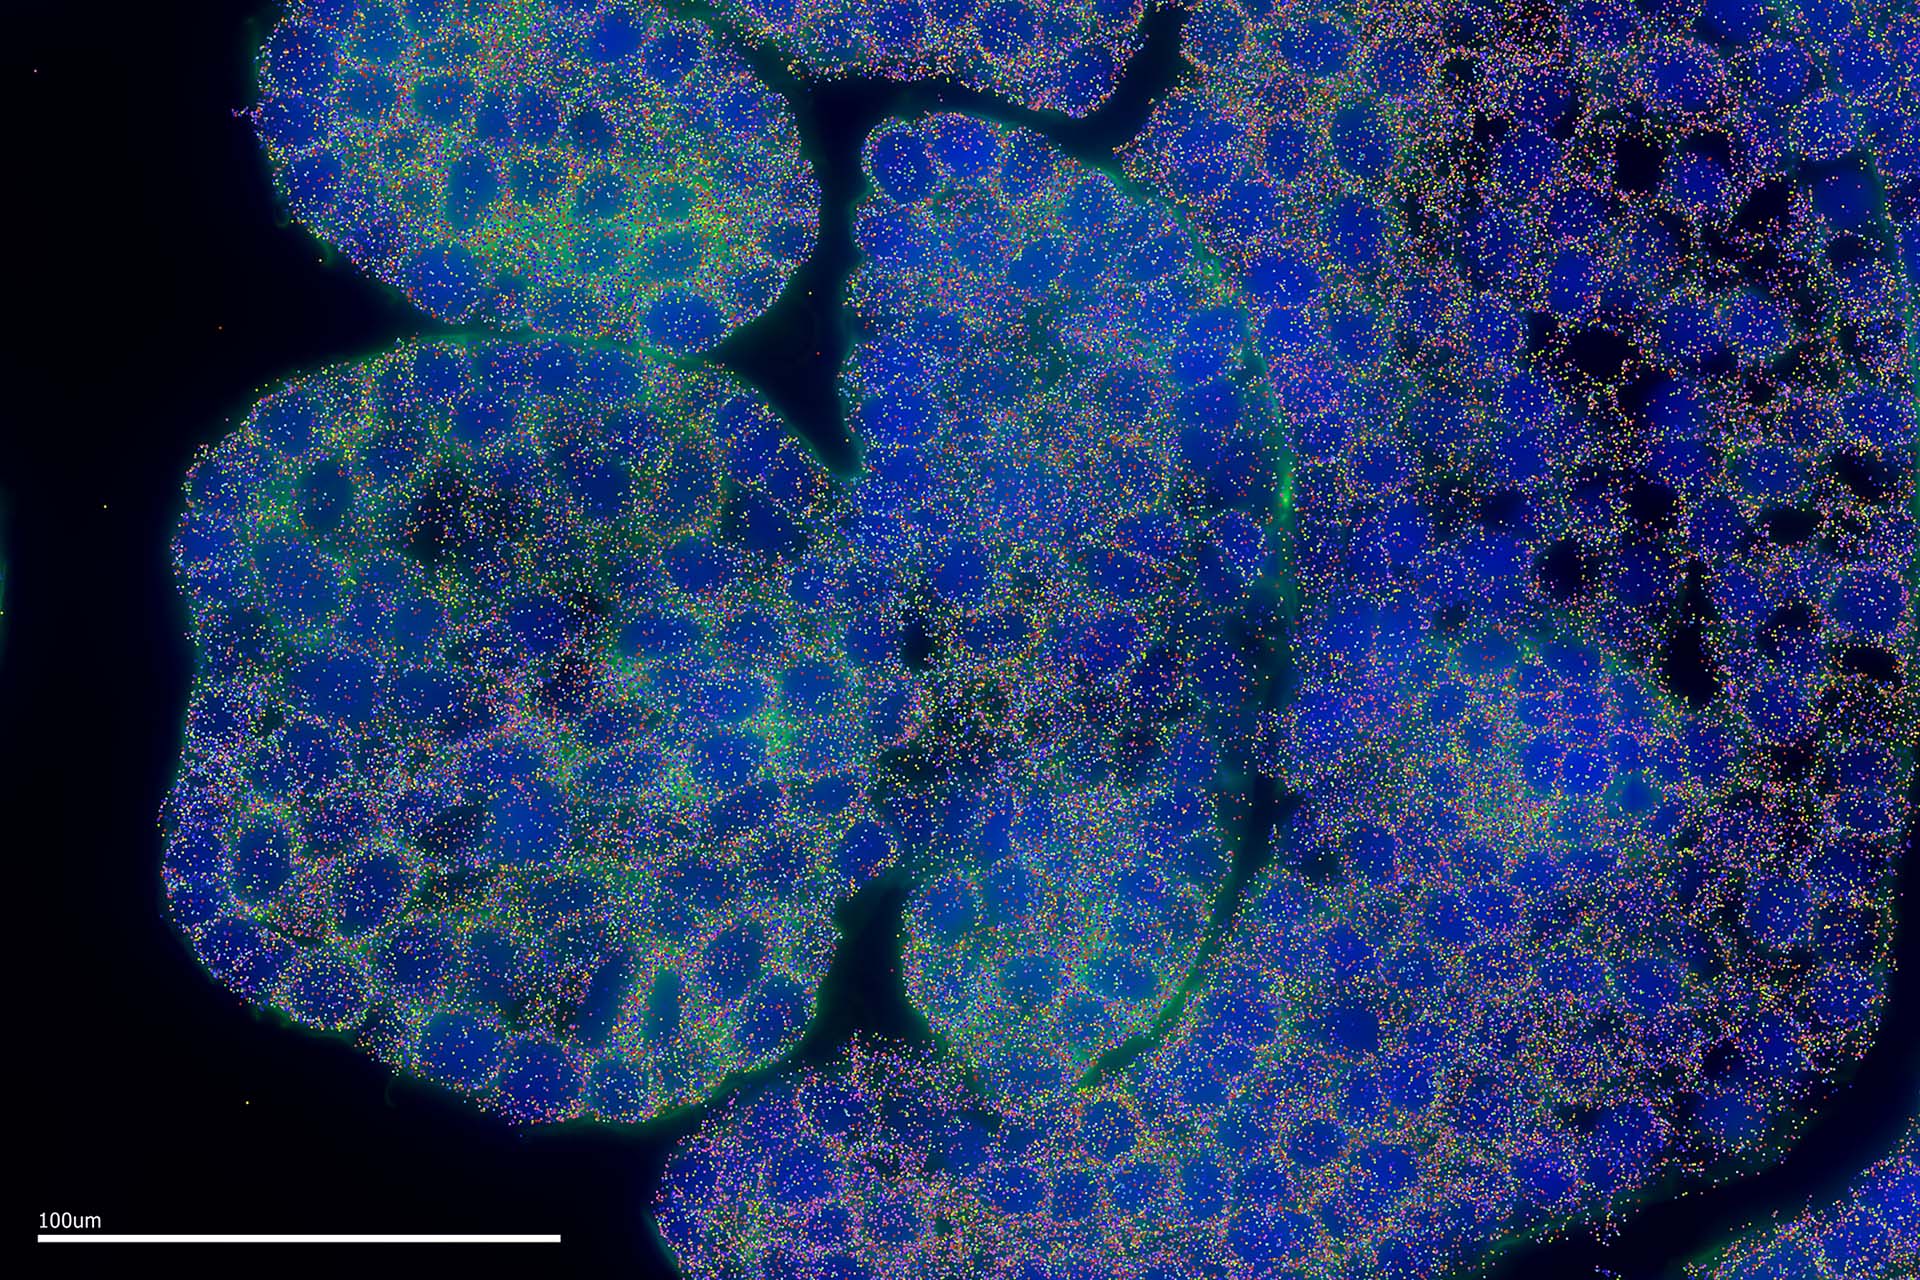
In a new study in The Plant Cell, the collaboration applied spatial transcriptomics, a powerful, emerging technology that visualises tissues at single cell resolution in situ, so that they can be observed fully in context of their location in the plant.
The technique is fraught with difficulties because plants have very tough cell walls and are prone to produce fluorescence which obscures results. Despite the challenges, the research team successfully mapped the expression of 200 genes in a set of wheat spikes at different development stages.
Their findings reveal highly distinct expression patterns across spikes, information which will help answer why basal spikelets (the structures at the base of the spike) often only produce rudimentary structures instead of harvestable grain, even though they are the first to form during development.
2.5 billion people depend on wheat as a source of food and as global populations grow, demand is expected to rise by over 60% by 2050. This study, by offering a blueprint as to how the wheat spike forms, will be crucial to improving wheat yields as scientists worldwide race to increase crop productivity.
A key priority was ensuring the data remains open access and available as a resource for future research and industry. To facilitate this, the team created a new platform where researchers worldwide can access and build upon these findings.
Team science is at the heart of this research success. Co-first author Ashleigh Lister, Senior Research Assistant at Earlham Institute, maximised the potential of the Vizgen MERSCOPE™, a spatial transcriptomic platform, to create protocols to observe gene expression in wheat tissue.
She said: "A lot of the methods I have used in this paper have been previously only applied to mammals, but by pushing the technical capabilities to allow for non-model species types we can then answer a wider variety of research questions. By utilising spatial transcriptomics in the developing wheat spike, we are able to inform strategies for global food security."
Co-first author Katie Long, Postgraduate Researcher at the John Innes Centre, prepared the samples and led the data analysis. Sample preparation involved dissecting up to a hundred plants a day and meticulously lining up tiny wheat spikes in a mold that was frozen into blocks before being prepared in 10-micron-thin sections to be analysed by the Vizgen MERSCOPE instrument. She explained: "Despite the challenges that tricky plant tissues threw our way, we have successfully mapped expression of 200 genes across wheat spikes to cellular resolution. This work provides researchers with valuable gene expression data while promoting wider adoption of spatial techniques through our optimised methods."
Dr Iain Macaulay, Group Leader at Earlham Institute, said: "This study is a prime example of how the expertise and infrastructure we have built up in our single-cell and spatial platforms can support the breadth of research happening on the Norwich Research park. Spatial transcriptomics techniques have immense potential in the plant sciences and it has been a pleasure to see Ashleigh and Katie develop an amazing collaboration that has produced such beautiful data."
Professor Cristóbal Uauy, Director of the John Innes Centre and corresponding author of the study, said: "This research is a perfect example of the power of our cross-institute programmes, which allow us to link across organisations and disciplines, answering more complex questions than we could achieve alone. By showing wheat's genetic makeup in a new light and making these new resources accessible to others, we open a realm of possibilities for the global wheat community and plant scientists."
The paper 'Spatial Transcriptomics Reveals Expression Gradients in Developing Wheat Inflorescences at Cellular Resolution' is published in The Plant Cell Journal.
Top Image – A whole developing wheat spike, 1mm scale. The blue represents fluorescent staining for DNA withing the nuclei. There are different coloured spots showing gene expression detected using the probes in a method called MERFISH on Earlham institute's Vizgen MERSCOPETM platform.
Images credit: Ashleigh Lister, Earlham Institute, and Katie Long, John Innes Centre


