Every spring and fall, Mason Leavitt and his colleagues at Beyond Toxics would start getting calls. Someone would hear of pesticide spraying nearby and want more details.
"We'd get dozens of people asking: 'What's going on near my home? What chemicals are being applied? Who's applying them?'" said Leavitt, a GIS analyst and programs coordinator with Beyond Toxics, a nonprofit environmental justice organization. "I would spend two hours going through different databases to get the answers."
He wondered if there was a better way to convey the information, envisioning an interactive map where people could access historical state data. Leavitt knew just the place to help him produce it: the InfoGraphics Lab at the University of Oregon, which for nearly 40 years has translated data into visuals that bring it to life.
Together, the InfoGraphics Lab and Beyond Toxics collaborated on a dynamic map that has pulled back the veil on pesticide use in the state. The map not only provides a public service but also served as a training ground for students learning how to communicate complex data.
"The goal in this situation is to take what is very often hidden and make it visible," said lab director Erik Steiner. "It's really about translating research into publicly available content."
Since 1988, the InfoGraphics Lab has partnered with faculty researchers and outside organizations to visualize information using tools at the forefront of technology. Steiner distills the lab's mission to three words: "Data, design, difference." The last word signifies both what makes a researcher's data stand out as novel or original, and a dedication to using data to make change.
While the state may provide sporadic information about pesticide sprays, there was no resource where the public could easily see a long-term record of pesticide applications. "So this clearly fits our mission of being a difference-maker through design," Steiner said.
Making the invisible visible
Across Oregon, private companies use their own land or lease state forestland for large plantations of Douglas fir, applying pesticides on the ground through spraying and aerially via helicopters and drones. Both methods can eventually transmit toxic chemicals into the air and water, posing potential health risks.
"A lot of these are known neurotoxins, or known to cause cancer, or have acute respiratory impacts," Leavitt said.
He graduated from the UO with a geography degree in 2020 and is now pursuing a master's degree in geography and environmental studies while working at Beyond Toxics.
Residents call Beyond Toxics to find out when to temporarily leave their homes during spraying events, as well as to organize broader campaigns against chemical use.
Landowners are required to report data to the Forest Activity Electronic Reporting and Notification System, which includes information on timing, locations, chemicals and application methods. But the information is fragmented across several datasets, making it difficult to interpret. Concerned residents can sign up for alerts from the Oregon Department of Forestry when spraying occurs near their homes.
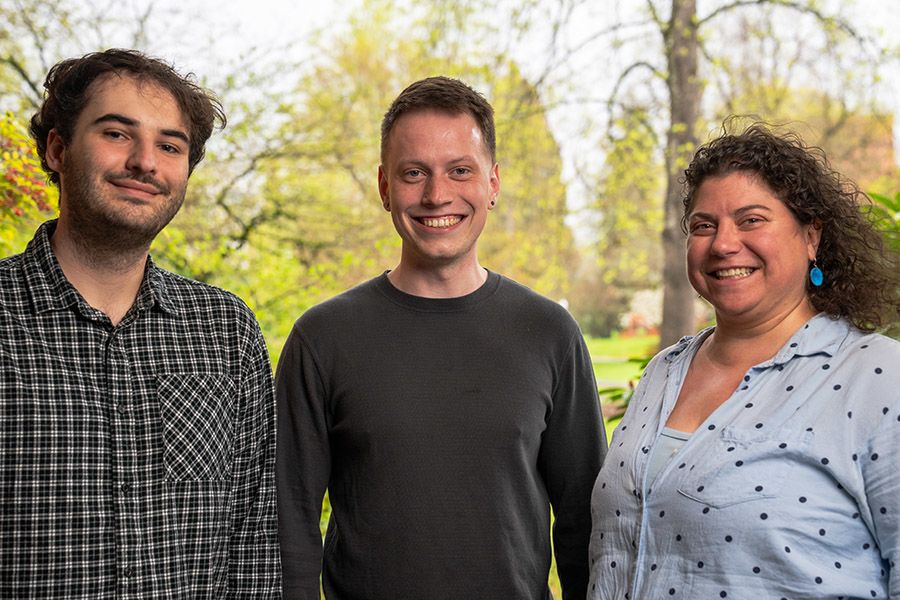
Leavitt first worked with InfoGraphics Lab student employee Zoe Kleiner, a 2024 graduate in geography and environmental studies. Kleiner created a method to merge the datasets, resulting in 10 years of data, spanning 2014 to 2024.
Once the data were organized, Leavitt met with the InfoGraphics Lab's cartographic developer, Joanna Merson, to begin envisioning the map. This involved whiteboard "wireframing" to establish the overall map design.
They were joined by then-student employee Michal Klopotowski, who graduated in December 2025 with a major in data science and a concentration in geography. He used the wireframing decisions, along with InfoGraphics Lab best practices, to develop accessible to viewers regardless of their scientific background.
"I wanted to be able to show it to my parents or my friends and have them understand it without any external instruction," he said.
"A lot of these are known neurotoxins, or known to cause cancer, or have acute respiratory impacts."
Mason Leavitt
GIS analyst and programs coordinator with Beyond Toxics
Learning by doing
Student employees like Kloptowski come to the InfoGraphics Lab from the School of Data Science, as well as from geography, journalism, environmental science and other departments, often working on several projects at once.
In addition to applying classroom skills to real-world design work, they learn project management and communication as they work to understand a partner's data and priorities, Merson said.
"Being able to work with someone who knows their data well and helping tease out how you're going to represent that data is the ultimate goal, both in the research environment, with project partners or with clients," she said.
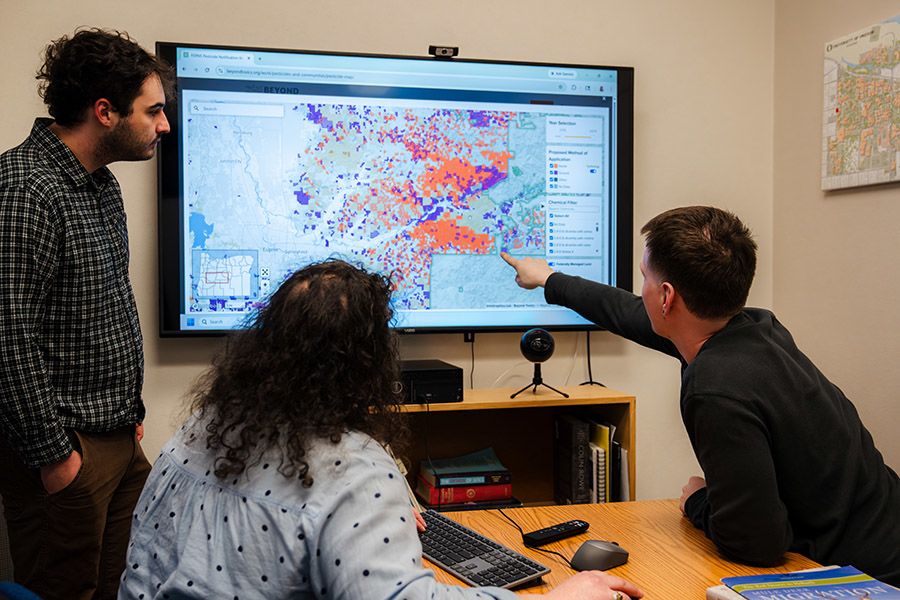
For the pesticides map, Merson and Klopotowski muted highways and other background details to highlight land where pesticide application permits had been filed. They chose a bold orange color that would stand out without being overly alarming.
Klopotowski added familiar plus and minus controls and an inset map to help users navigate and zoom in. They also included a toggle that allows users to recolor the data based on the method of pesticide application. Clicking on land parcels reveals more information about each permit, including links to the original pesticide application notifications - the raw data behind the map.


