Researchers from the Aerospace Information Research Institute (AIR) of the Chinese Academy of Sciences have developed a novel method for mapping carbon dioxide (CO2) emissions across Nanchang, the capital city of Jiangxi province in eastern China. This study provides a clearer picture of the city's carbon footprint and has been published in the International Journal of Digital Earth.
The researchers utilized multiple data sources, including satellite remote sensing imagery, nighttime light data, statistical yearbooks, and point-of-interest (POI) information, to create a detailed, high-resolution map of urban CO2 emissions. By applying an inventory method to account for total annual carbon emissions and then distributing this data spatially and temporally by sector, they achieved results that are significantly more accurate than existing datasets, such as the Open-source Data Inventory for Anthropogenic CO2 (ODIAC). The overall margin of error remained a manageable 13.9%.
The study found that total CO2 emissions in Nanchang for 2020 amounted to 20.94 million tonnes. Although this figure is slightly lower than that of the previous year, emissions remain high, with the industrial and energy sectors contributing the most. Within the industry sector, the metal smelting industry was identified as the largest source of emissions, highlighting it as a critical target for future emission reduction strategies.
Geographically, the highest emissions were concentrated in and around Nanchang's core urban areas, where industrial land use is prevalent. Monthly trends indicated a general increase in emissions throughout the year, with slight decreases in September and November, followed by a notable rise in December, largely driven by fluctuations in industrial and energy sector activities.
Using this new methodology, CO2 emissions were mapped at a fine 30-meter resolution on a monthly basis, offering more details. The study's approach not only enhances the ability to monitor urban carbon dynamics but also provides valuable data for policymakers crafting emission reduction targets and strategies.
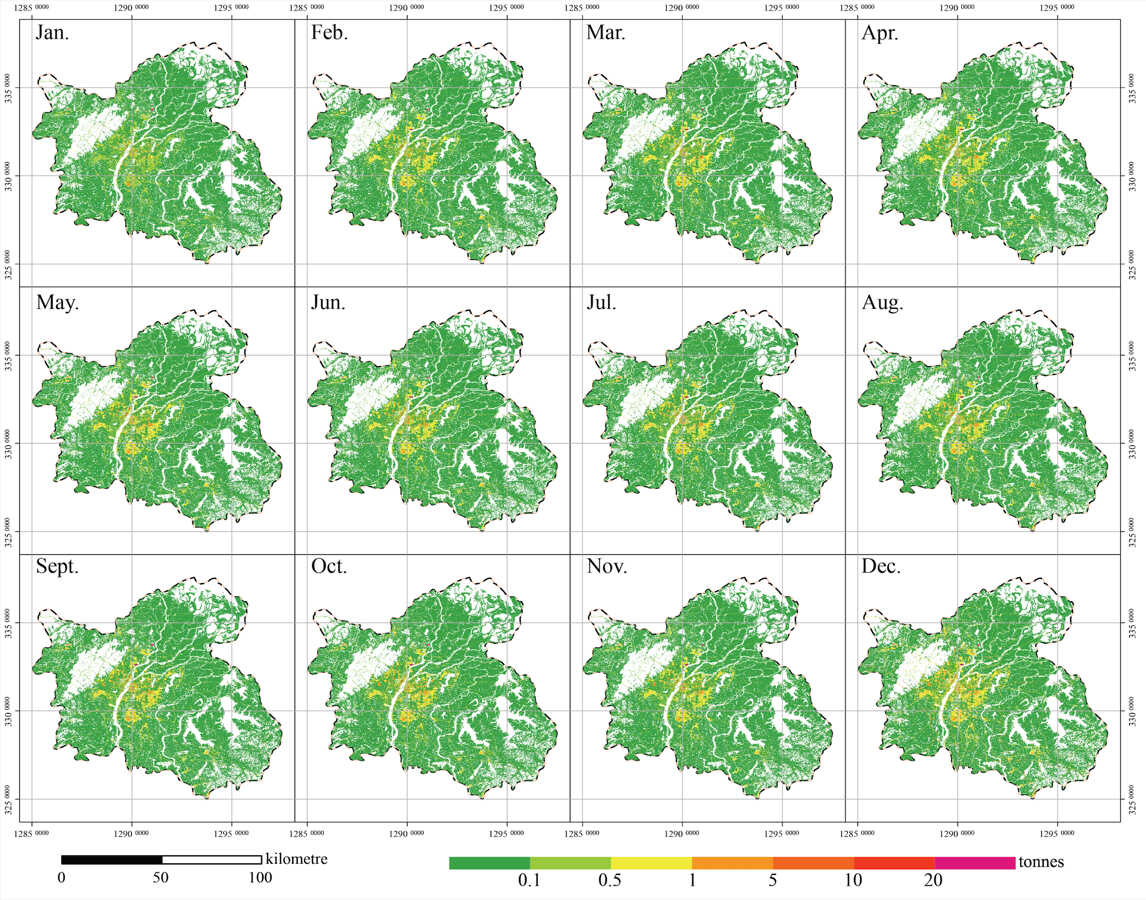
Distribution of monthly CO2 emissions of Nanchang in 2020 with 30-meter resolution. (Image by AIR)


