There was one striking difference between 2020, year one of the COVID-19 pandemic, and 2021, year two: in the second year, vaccines became readily available.
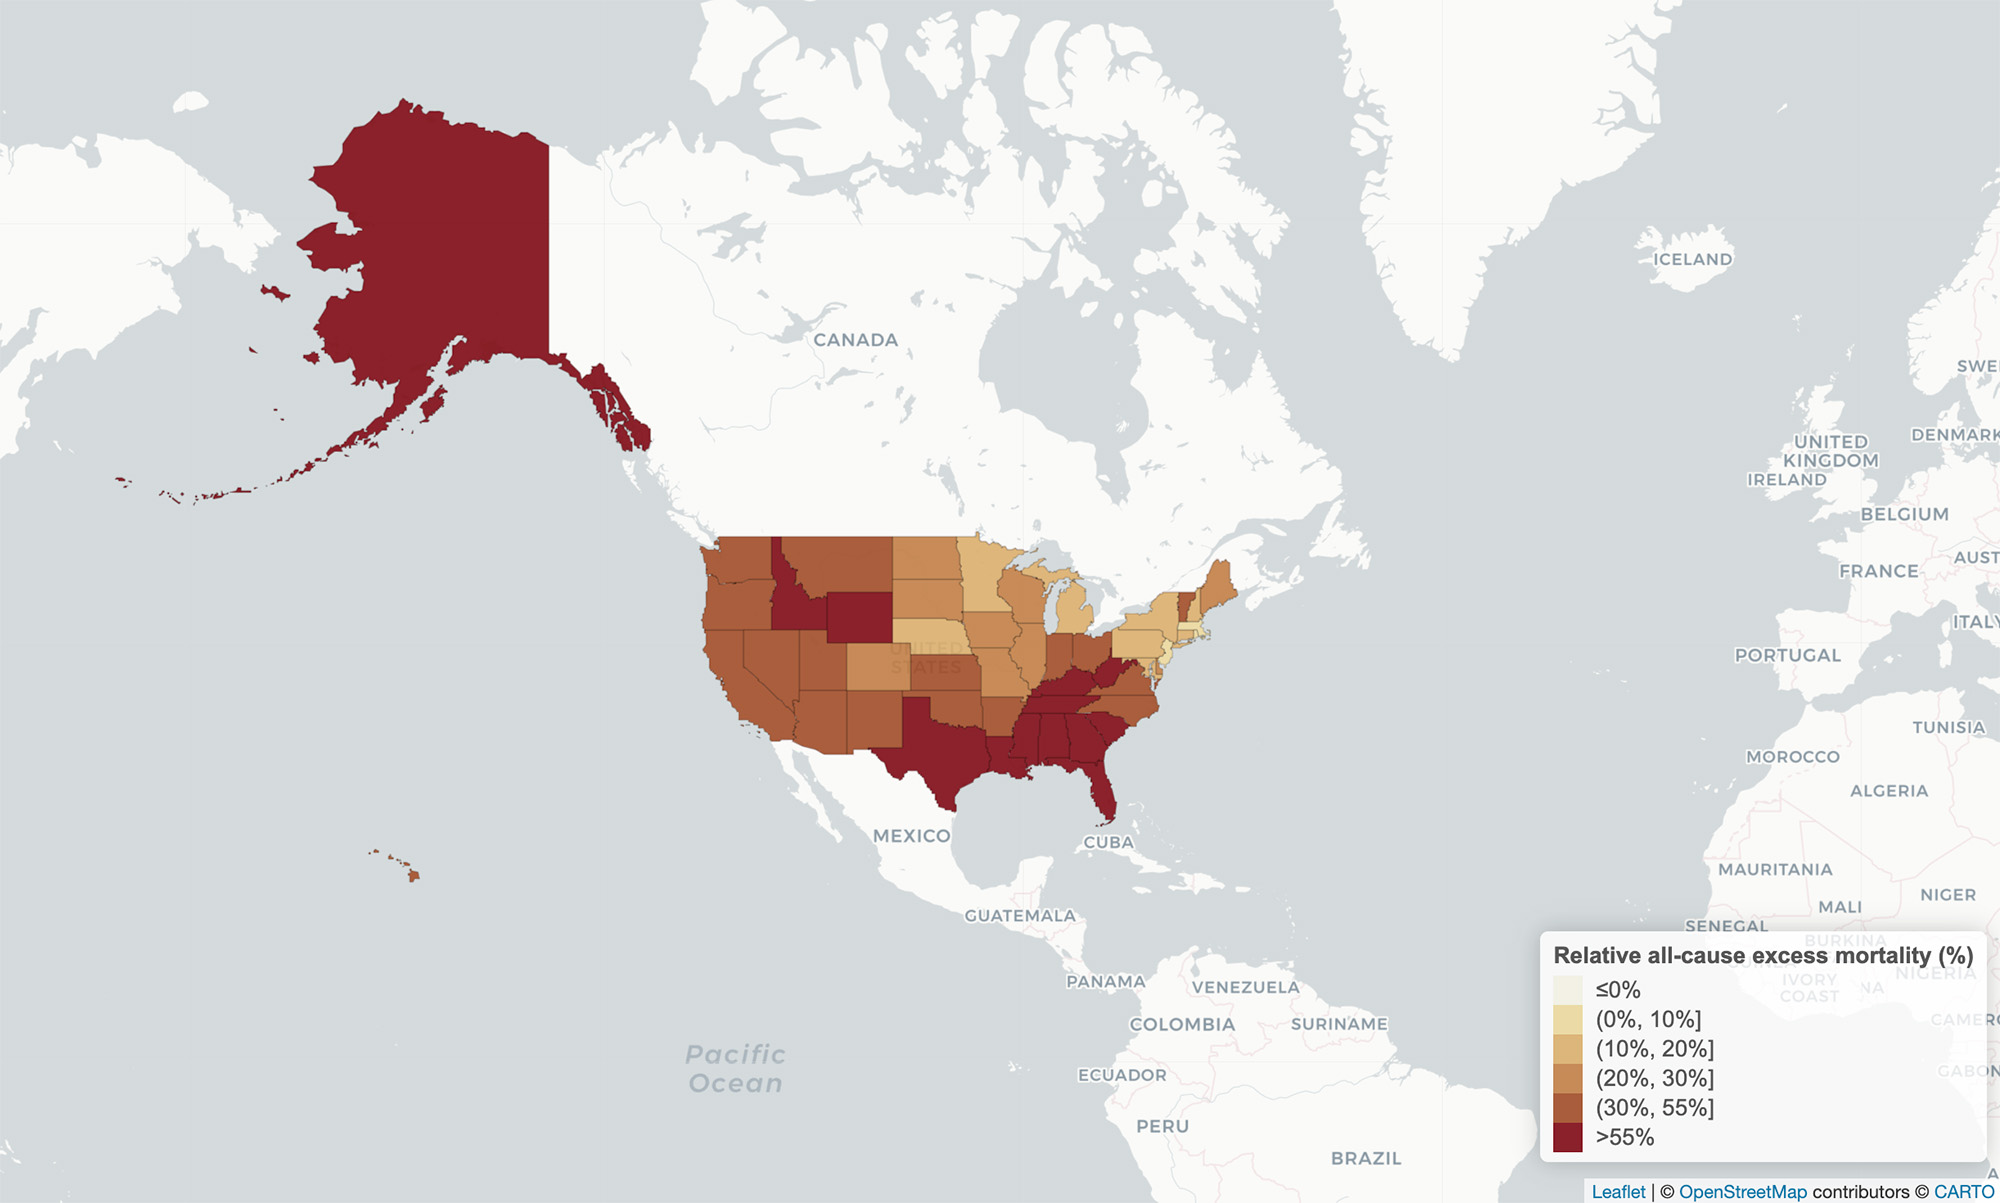
Presumably, vaccines created specifically to fight a new and deadly disease should have caused a dramatic reduction in deaths from that disease. And, according to new research from Boston University and the University of Pennsylvania, they did-but only in large, metropolitan counties. In rural counties across the United States-where vaccines were harder to obtain, where vaccine skepticism remained higher, and where access to good healthcare is often more challenging-excess deaths in year two of the pandemic actually increased, despite the presence of vaccines, according to the new study.
The study provides the first look at monthly estimates of what the researchers call "excess deaths" for every US county in the pandemic's first two years. It says an estimated 1,179,024 excess deaths occurred during those first two years (first: 634,830; second: 544,194), a figure found by comparing mortality rates across all US counties for those years versus the years 2015-2019.
"We define excess mortality as the difference between what was observed versus what we would have expected," says Andrew Stokes, a BU School of Public Health assistant professor of global health and corresponding author on the study.
The Brink spoke with Stokes about the new study, published this month in the journal Science Advances. Among his other studies into COVID was one looking at "hidden deaths" from the disease-where he found the unofficial pandemic death toll could be 20 percent higher than the formal count.
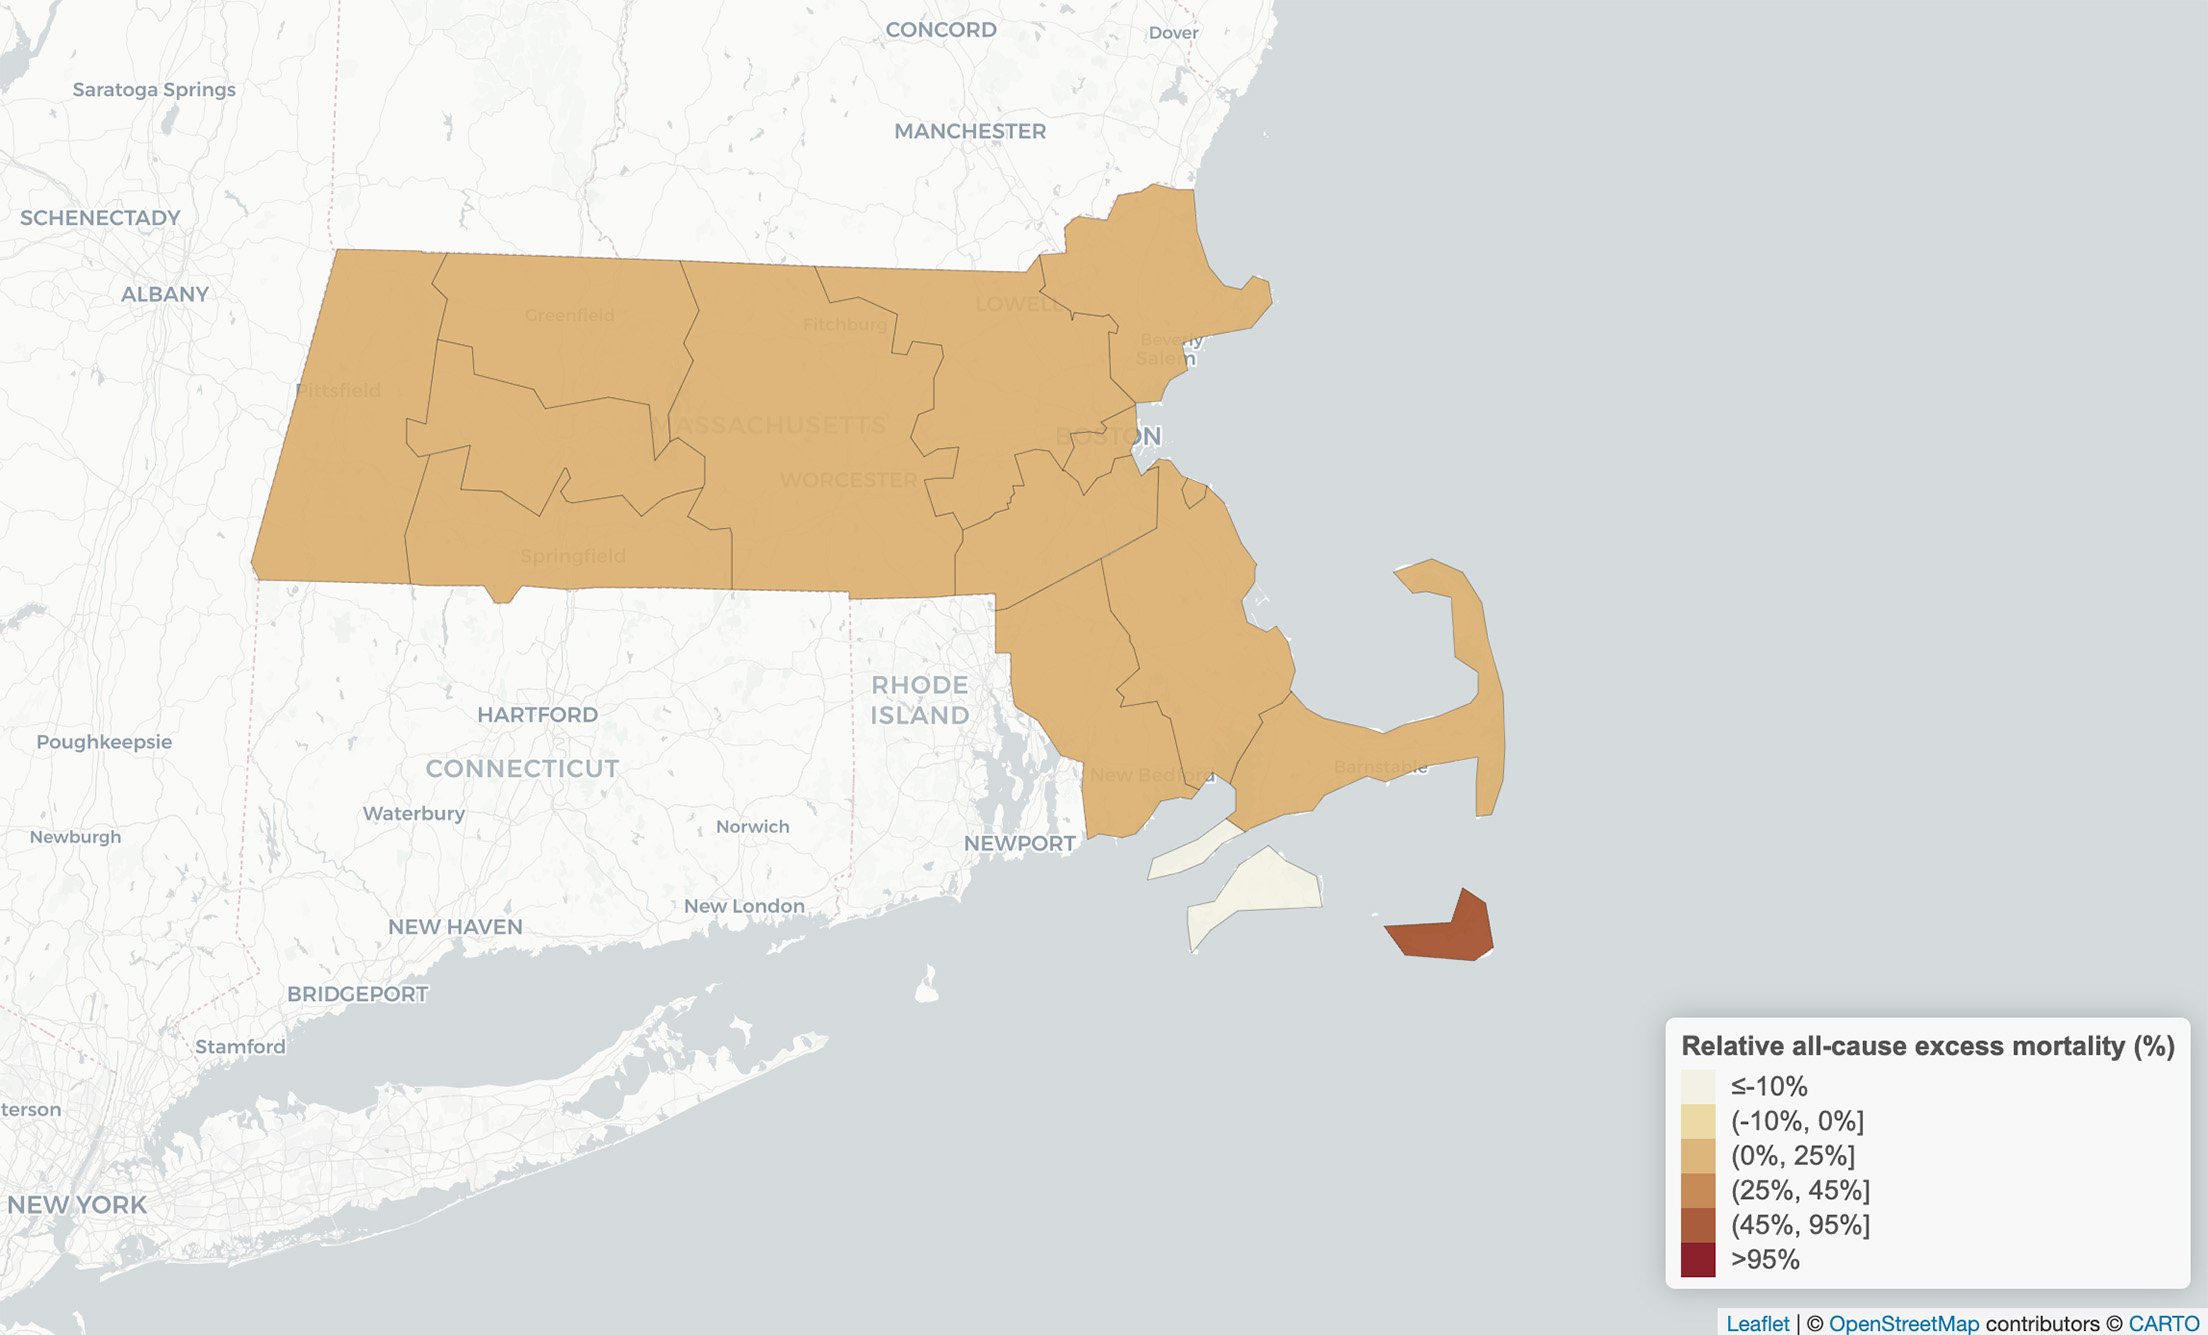
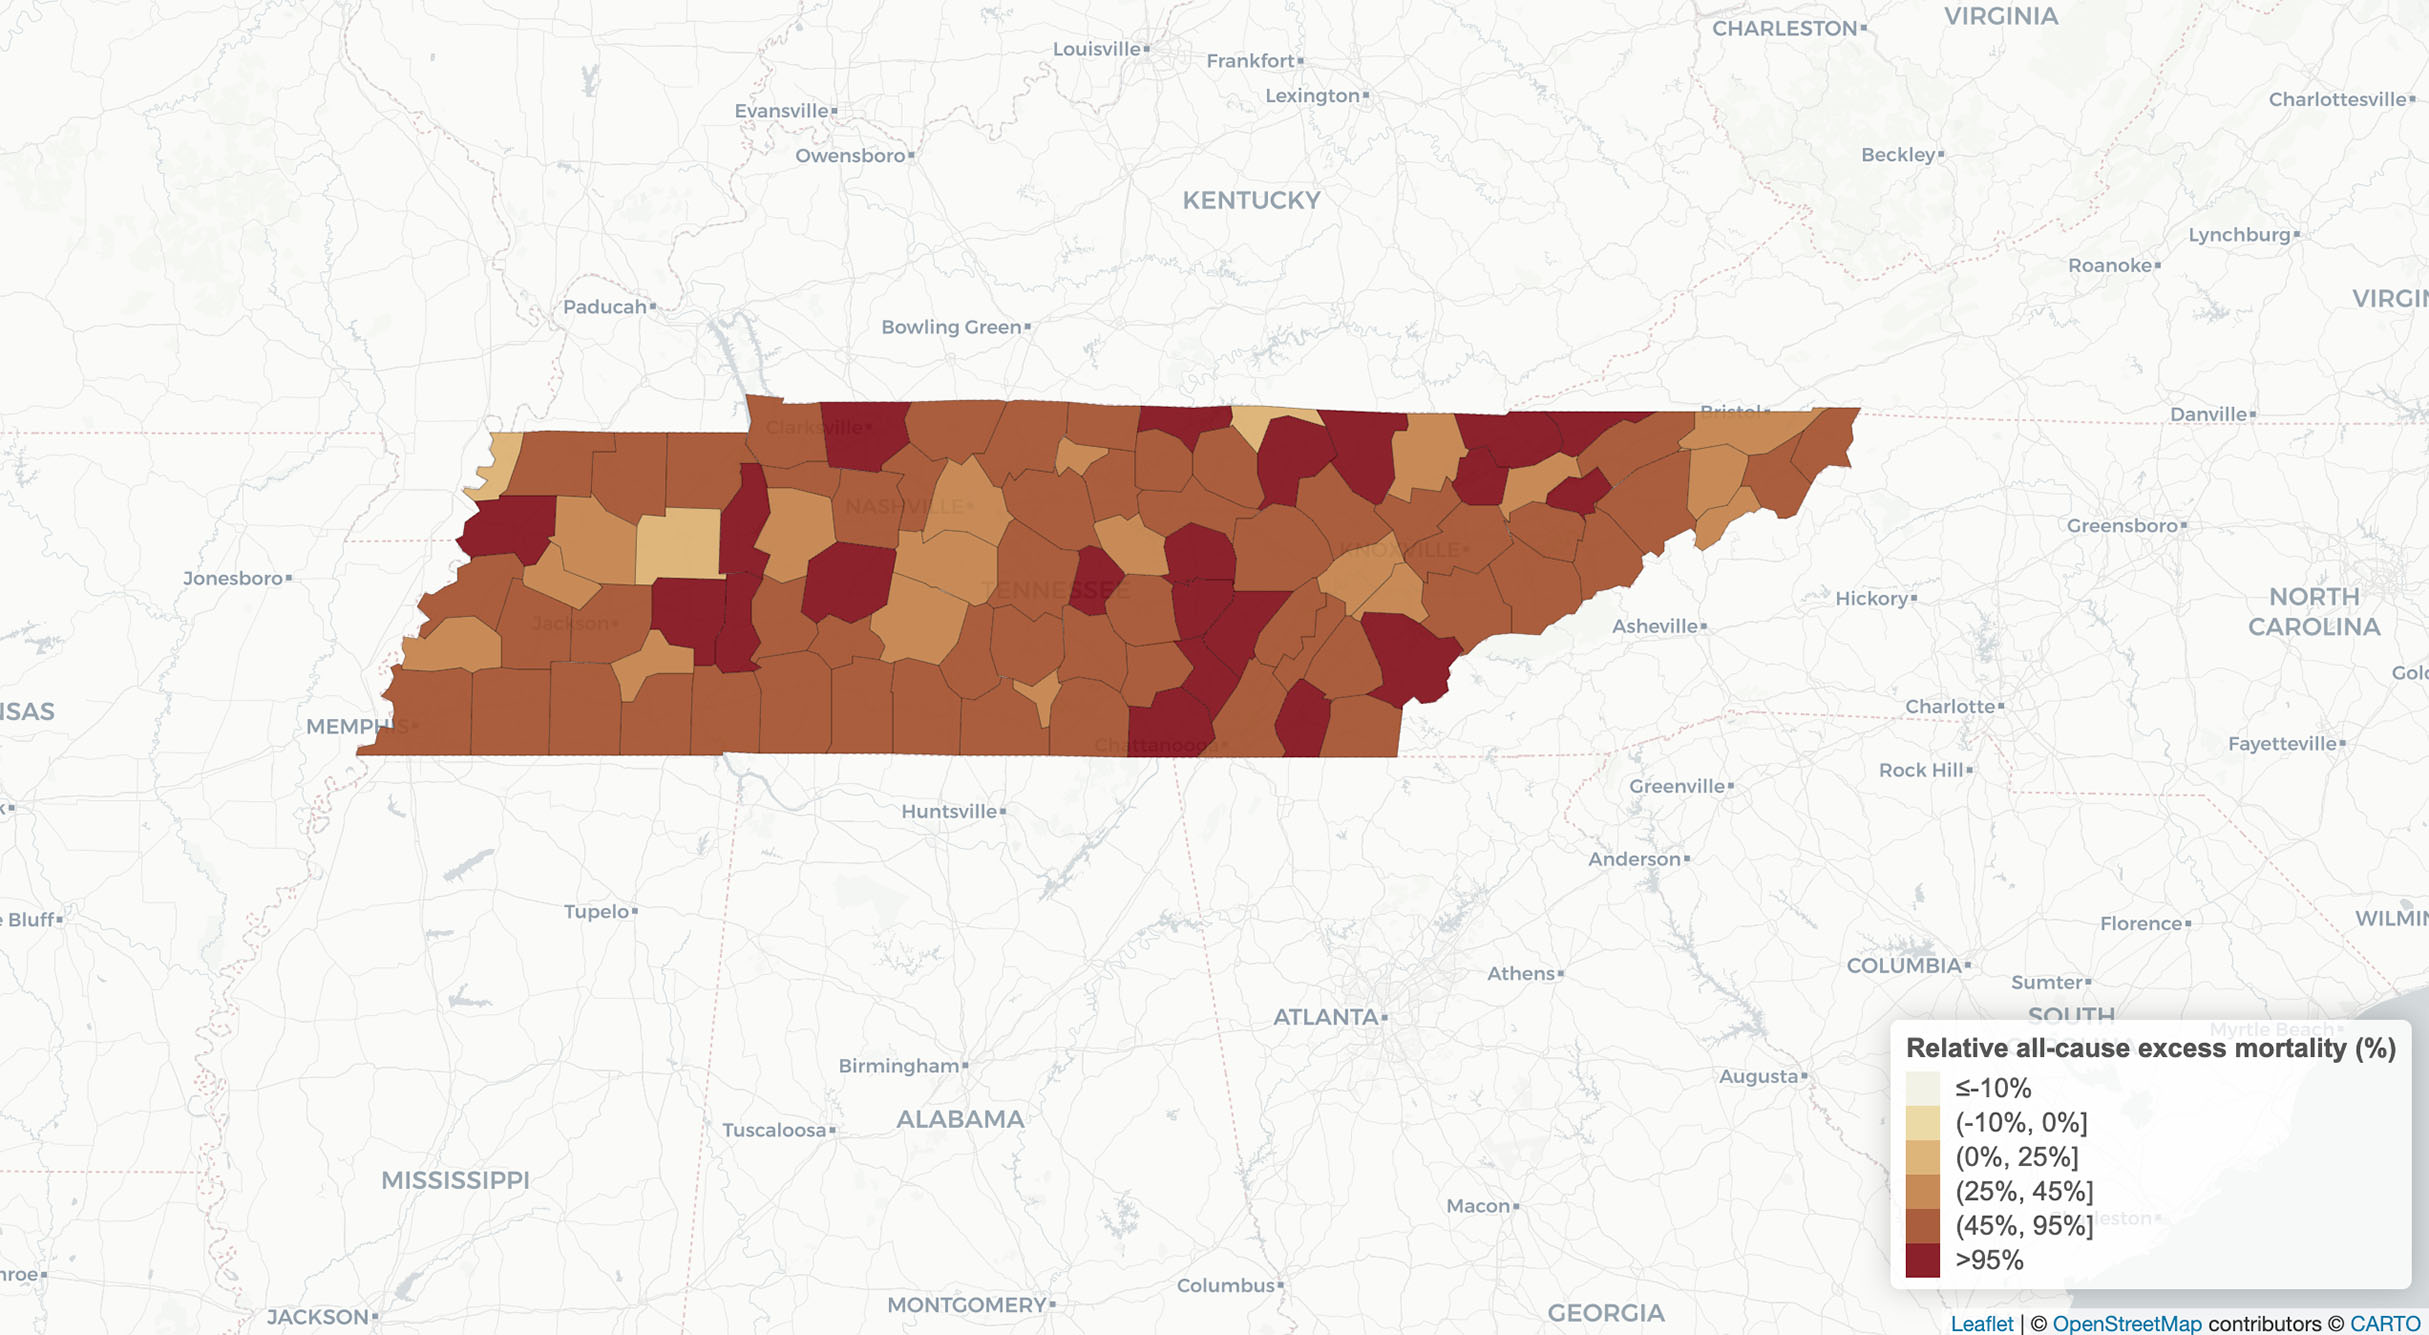
A snapshot of excess deaths in Massachusetts (left) and Tennessee (right) during September 2021. "Massachusetts had very little impact from Delta, where Tennessee had a profound Delta surge," says SPH's Andrew Stokes. "That was the first COVID wave during widespread vaccination." Courtesy Paglino E et. al.
This interview has been condensed and edited for clarity.
This research was supported by the Robert Wood Johnson Foundation, the National Institute on Aging, the W. K. Kellogg Foundation, the BU Center for Emerging Infectious Diseases Policy & Research, and the National Science Foundation.


