New study finds toilets and showers make up more than 70% of indoor water usage across all measured cities.
Credit: Geoffrey Fairchild
- Toilets and showers flush down more than 70% of indoor water consumption.
- Homes built around 1968 had better water usage on average compared to newer homes like those built around 1994.
- Home size and value weren't significant.
- Of represented cities, homes in California used the least water per capita in the study.
A new study on water usage inside U.S. homes found toilets led the way for the highest water use, followed closely by showers, while dishwashers used the least.
The new research also comes with some surprises, including the strong association of humidifiers to high water usage, while other findings may be less surprising, such as that heavily regulated cities in California having the lowest water usage in the study.
With data from more than 26,000 single-family homes across 39 cities, the study had a larger data pool than previous research. It is one of the first and largest snapshots of how households in the United States use water inside their home, with previous research not distinguishing between indoor and outdoor water use.
This study was published in Earth's Future, AGU's journal for interdisciplinary research on the past, present and future of our planet and its inhabitants. Landon Marston, an author on the study, said research into indoor water use was difficult before this study.
"We didn't have a great understanding of how much water was being used or how it was being used inside homes," said Marston, a researcher at Virginia Tech. "So, we kind of relied on these crude estimates to pinpoint that, and it's not that precise."
The data was provided by Flume, a company that sells sensors that can help detect water leaks in homes. The sensor monitors water usage and uses machine learning to identify which appliance is using the water. The result is then confirmed by the people in the household.
Marston and his team focused on the cold winter months of December and January. "In the summer, you might have some misclassification of water use, for example, outdoor water use mistakenly classified as indoor or vice versa," Marston said.
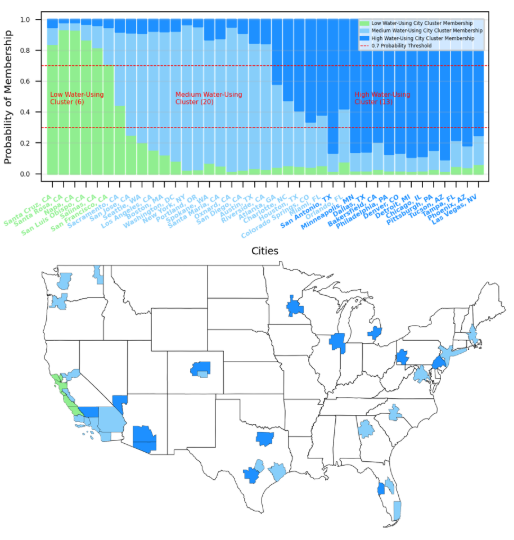
New study showed water usage in 39 cities, ranked from lowest in green to highest in dark blue. Bottom map shows low water usage cities in green, medium in light blue, and high in dark blue. Cities are ordered, from left to right on graph, in order of least usage to most.
Credit: Naseri, Bernosky, Mayer and Marston Earth's Future. https://doi.org/10.1029/2024EF005467
Las Vegas, Phoenix and Tampa ranked the highest cities for water usage while the lowest cities all fell in California. Marston and his team speculated in the research that California may rank that low due to state water conservation regulations. On average, cities with low water usage tended to be warmer and wetter compared to cities with high water usage that were cold and dry. In drier cities, indoor features like humidifiers were more common.
"What was really a driving factor was toilet events and showers," said Marston. "We now look at this across the nation and find a similar pattern. That's really a driving force."
The researchers hope the information could help communities adapt water usage plans to better fit. "Conservation efforts focused on reducing indoor residential water use can be most effective if they target these two end uses," said Yunus Naseri, lead author of the study.
Toilets used around 40% of all indoor water in all household types. Showers followed toilets, using about 30% of water. Faucets and other miscellaneous objects made up the rest.
Homes built before 1985 were found to be associated with lower water usage compared to homes built later. Cities with low water use often had a higher number of these older homes. Homes built after 1985 were more likely to use humidifiers, which were more common in high use cities and were associated with an increase in water usage in the homes they were found in.
Marston noted there are limitations to the study. The sensors were self-bought by consumers, some with rebate incentives. The data was collected by Flume for internal use but provided to researchers for the purpose of the study. This process could have influenced the outcome, while still providing a large dataset with which to build off. However, this research serves as a good pilot program to open more questions on how Americans use water, Marston said.
Notes for journalists:
This study is published in AGU Advances, an open-access AGU journal. View and download a pdf of the study here. Neither this press release nor the study is under embargo.
Paper title:
"Patterns and Predictors of Residential Indoor Water Use Across Major US Cities"
Authors:
- Md Yunus Naseri (corresponding author), Department of Civil and Environmental Engineering, Virginia Tech, Blacksburg, Virginia, USA
- Grant Bernosky, Flume, San Luis Obispo, California, USA
- Peter W. Mayer, WaterDM, Boulder, Colorado, USA
- Landon T. Marston, Department of Civil and Environmental Engineering, Virginia Tech, Blacksburg, Virginia, USA
#
AGU (www.agu.org) is a global community supporting more than half a million advocates and professionals in Earth and space sciences. Through broad and inclusive partnerships, AGU aims to advance discovery and solution science that accelerate knowledge and create solutions that are ethical, unbiased and respectful of communities and their values. Our programs include serving as a scholarly publisher, convening virtual and in-person events and providing career support. We live our values in everything we do, such as our net zero energy renovated building in Washington, D.C. and our Ethics and Equity Center, which fosters a diverse and inclusive geoscience community to ensure responsible conduct.
#
Subscribe or change your emailing preferences for the AGU Newsroom
#
Contributed by Riley Thompson


