The way people move around in cities gives us clues as to when many crimes are committed and in which hotspots, as ETH researchers have demonstrated using anonymised data from location technology plattforms.

When and where does crime arise in cities? To answer this question, criminologists have previously relied on rather static models. Crime has been linked, for example, to the structure of the resident population or to the use of land in a neighbourhood. The influence that mobility has on the incidence of crime was previously an unknown quantity.
Now, however, researchers from ETH Zurich, the University of Cambridge and New York University have been able to demonstrate for the first time that crime is directly related to how many people are in a city, where they are and where they are going. Cristina Kadar, a computer scientist and former doctoral student at the Mobiliar Lab for Analytics at ETH, led the study. She recently presented the results at a (virtual) conference on computational social science.
Analysis of mobility flows
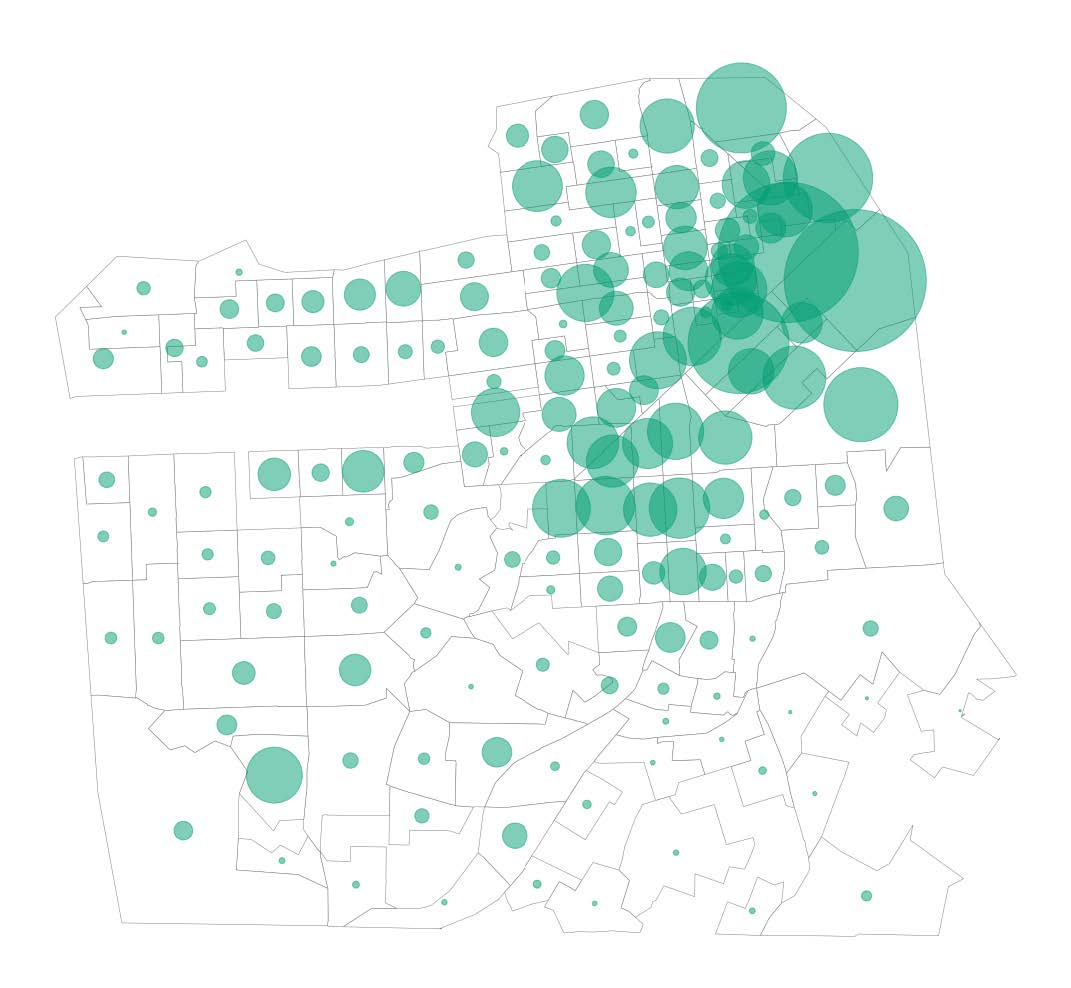
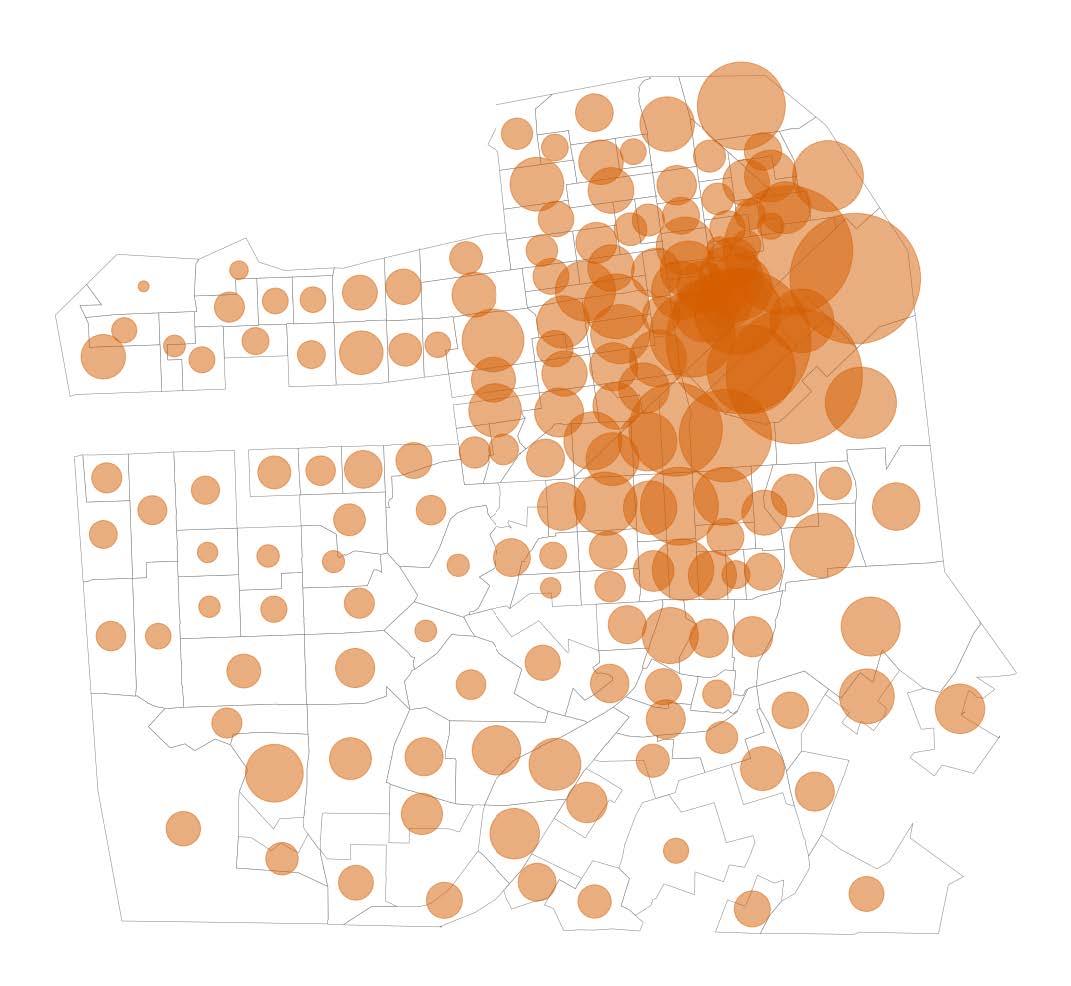
The researchers calculated mobility flows from aggregated and anonymised location data. In their study, they used three complete sets of anonymised data relating to the cities of San Francisco, Chicago and Philadelphia from the years 2012 and 2013. They obtained the information from the location technology platform Foursquare, which is based on millions of "check-ins", i.e. locations that users have actively shared. Before making the data available to the scientists, the company made sure personal data and all check-ins at users' home addresses had been deleted.
In their analysis, the researchers compared the datasets with crime statistics from the same period, focusing specifically on offences relating to theft, robbery, assault, burglary and stolen vehicles.
More activity, more crime
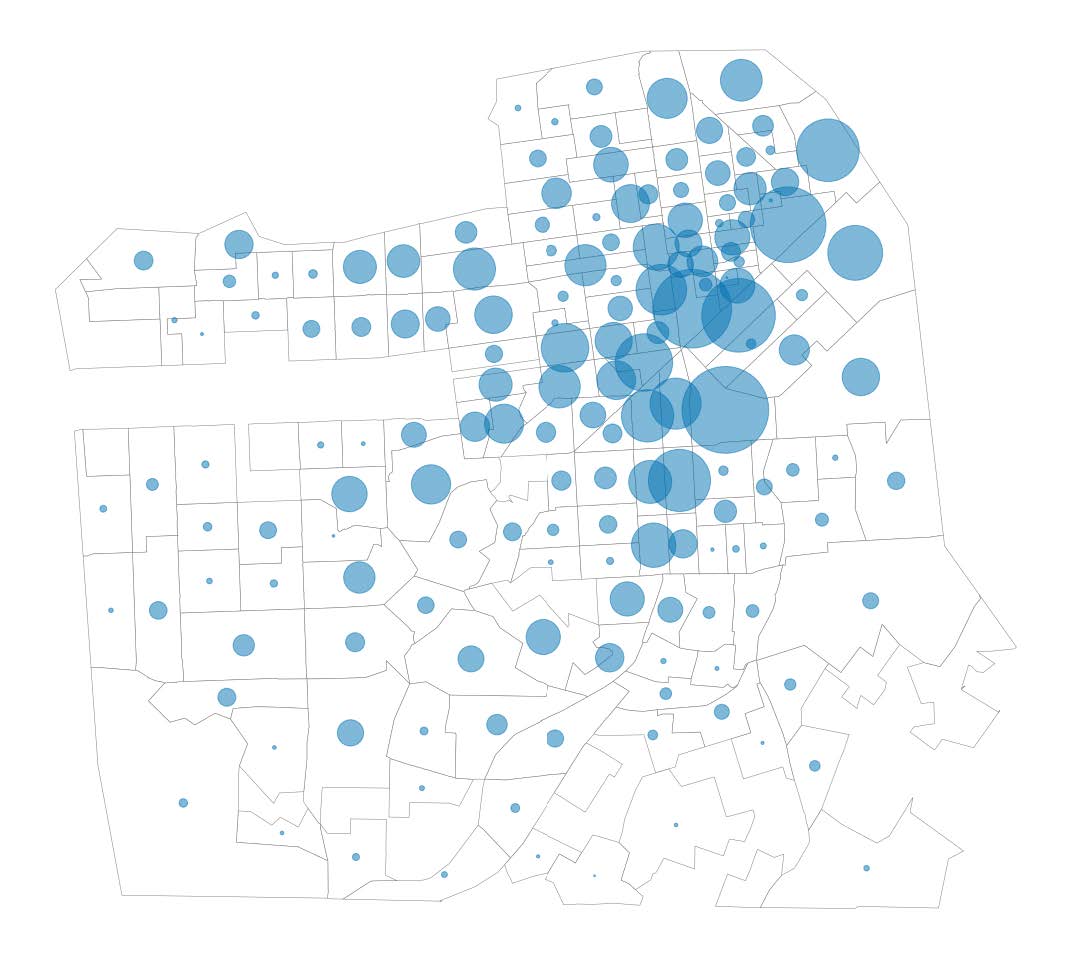
They found that the more activity the platform's data showed for a specific time and district, the greater the number of offences that had been committed there.
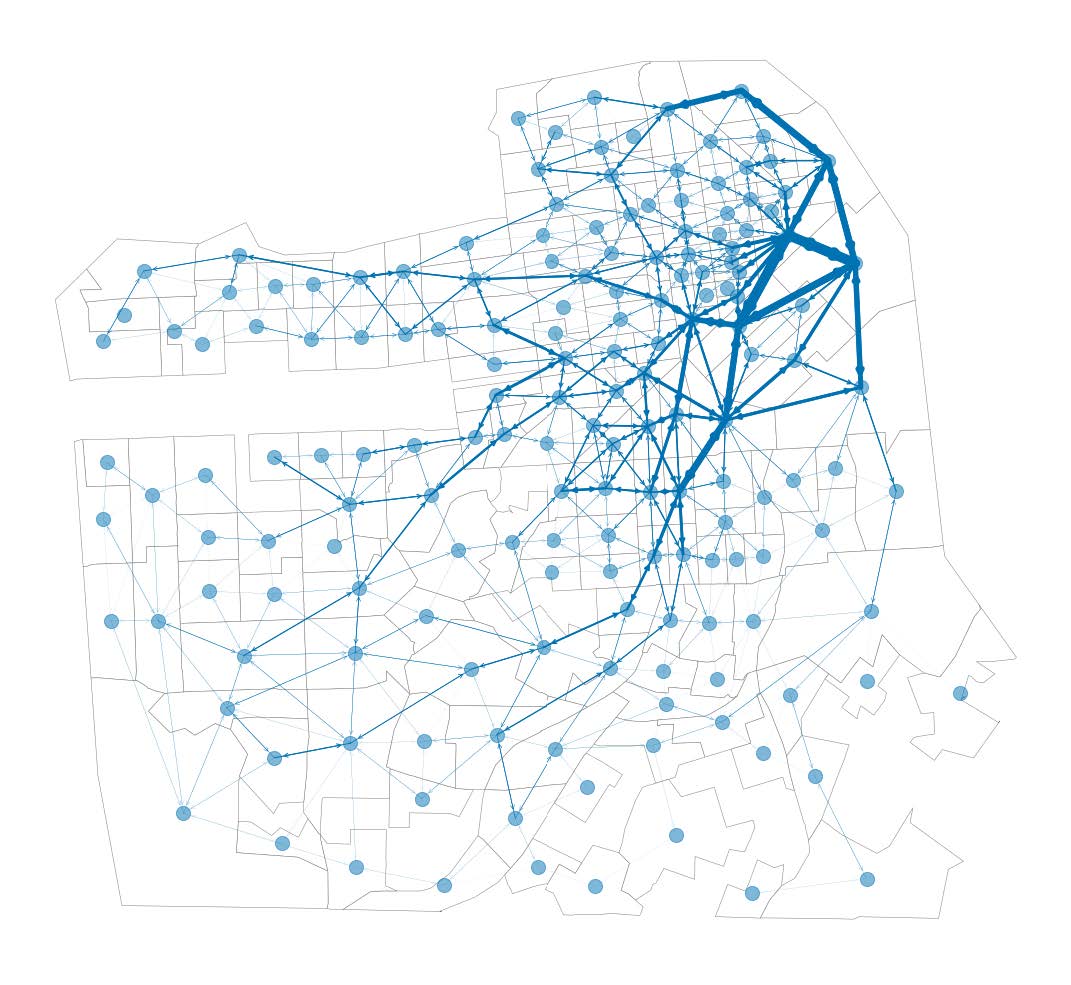
When calculating "activity", the researchers included check-ins at restaurants, shops or sports facilities as well as any instances of people passing through a given district on their way between two check-ins. Their calculations of the paths between two check-ins were based on the assumption that users choose the shortest route and navigate their way using existing traffic routes.
Danger lurks en route
In fact, it is these intermediate journeys that have the greater influence on crime rates. In other words, crime is most likely to arise in those areas that people pass through between completing two routine activities, for example on the way from work to the shops or to take part in recreational activities. The results support a popular theory from criminology positing that crimes occur where the paths of perpetrators and victims cross.
"I'm exited that we can use data that essentially has nothing to do with criminal offences to characterise crime so well," Kadar says. Never before have we been able to demonstrate the link between people's mobility and crime in such a granular way in terms of time and space, she explains.
The researchers also broke down their analysis by type of activity and offence. This revealed that more crime was recorded in places and time periods with a large number of recreational activities, but this was not the case with shopping, for example. In terms of the type of offence committed, the researchers found the strongest positive relationship from activity with thefts, and the weakest with robberies.
Predictions also possible
In addition, the researchers examined whether it would be possible to use the mobility data to predict crime using machine learning. To do this, they trained different models once with the Foursquare datasets and once just with data on past offences. Next, they checked the accuracy of the forecasts against the actual offences recorded. They discovered that the prediction models that were fed mobility data performed significantly better than predictions based on previous crimes.
Support for research
Kadar sees her study primarily as a means to support research. By providing evidence for the crime pattern theory, it helps improve understanding of the origins of crime. She believes her work also demonstrates the usefulness of big data for computational social science, but notes that further studies are required to validate the findings before public authorities can apply them to design and build safer cities. That is because the analysis should be revisited with a number of different datasets to calibrate any potential platform bias. And although the results of the study can be applied to large cities, they might not be relevant for smaller ones.
References
Kadar C, Feuerriegel S, Anastasios N, Mascolo C: Leveraging mobility flows from location technology platforms to test crime pattern theory in large cities. Proceedings of the International Conference on Web and Social Media 2020.