Key takeaways
- UCLA researchers' 2025 Southern California Community Water Systems Atlas analyzes 663 community water systems serving 40 percent of the state's population, giving policymakers, researchers and communities an unmatched tool to track water system performance and target solutions.
- The report, interactive map and dataset show that seven different water governance structures create uneven service and accountability, and stark disparities: Kern County had more than 1,500 water quality violations in the past decade, while Orange County reported just five violations over the same period.
- In Los Angeles County, water bills have risen nearly 60 percent over 10 years, vastly outpacing inflation and straining lower-income households.
Community water systems are the fundamental building blocks of California's water supply. They provide drinking water to millions of households, businesses and institutions across the state. But who governs these systems — and how they are managed — has a direct impact on whether communities have access to safe, affordable and reliable water and if they can adapt to drought and climate change.
The 2025 Southern California Community Water Systems Atlas, produced by the UCLA Luskin Center for Innovation and UC Division of Agriculture and Natural Resources, shows how fragmented governance affects communities differently. The Atlas expands the scope of earlier UCLA studies to cover not just Los Angeles County, but 663 systems across six counties: Los Angeles, Kern, Orange, Riverside, San Bernardino and Ventura. Together, these utilities serve 40 percent of California's population. The report and companion mapping tool provide the most comprehensive public resource on water systems, shedding light on disparities in water quality, affordability, governance and climate resilience.
Fragmented governance
Water systems in Southern California operate under at least seven different governance structures, ranging from tiny mutual associations to large city-run utilities. This fragmentation complicates oversight, resulting in uneven capacity and disparities in service. It also makes it harder to fix water quality violations, which happen when drinking water has more harmful contamination than regulations allow.
"Governance determines whether a water system has the resources and oversight it needs to succeed," said Edith B. de Guzman, water and adaptation policy cooperative extension specialist with the Luskin Center for Innovation and UC Division of Agriculture and Natural Resources. "This Atlas makes clear that the small and under-resourced systems that millions of Californians rely upon and which are often fragmented, face persistent barriers to meeting water quality, affordability and equity goals."
In recent years, Los Angeles County has made modest progress with slightly declining water quality violations, in part because some small systems have been consolidated into larger providers. A 2021 Luskin Center for Innovation study led by the center's senior director, Gregory Pierce, and Kyra Gmoser-Daskalakis found that systems with less consolidated governance or infrastructure have more water quality and affordability problems.
These governance gaps show up most clearly in water quality data, where some counties consistently perform better than others.
Water quality varies from county to county
Kern County recorded more than 1,500 drinking water quality violations in the past decade — far more than any other county. (The top contaminants causing violations in Kern County are arsenic, coliform, 1,2,3-Trichilorpropane and nitrate.) In contrast, Orange County's more consolidated governance consistently ranks among the best performers. Los Angeles County shows modest but meaningful improvement, with larger utilities investing in upgrades that have greatly reduced violations. The top contaminants causing violations in the county are arsenic and coliform, with nitrate and manganese a distant third and fourth place.
However, many smaller systems in all counties lack the technical, managerial and financial capacity to make similar improvements, perpetuating inequities to safe and affordable water access.
Affordability is uneven
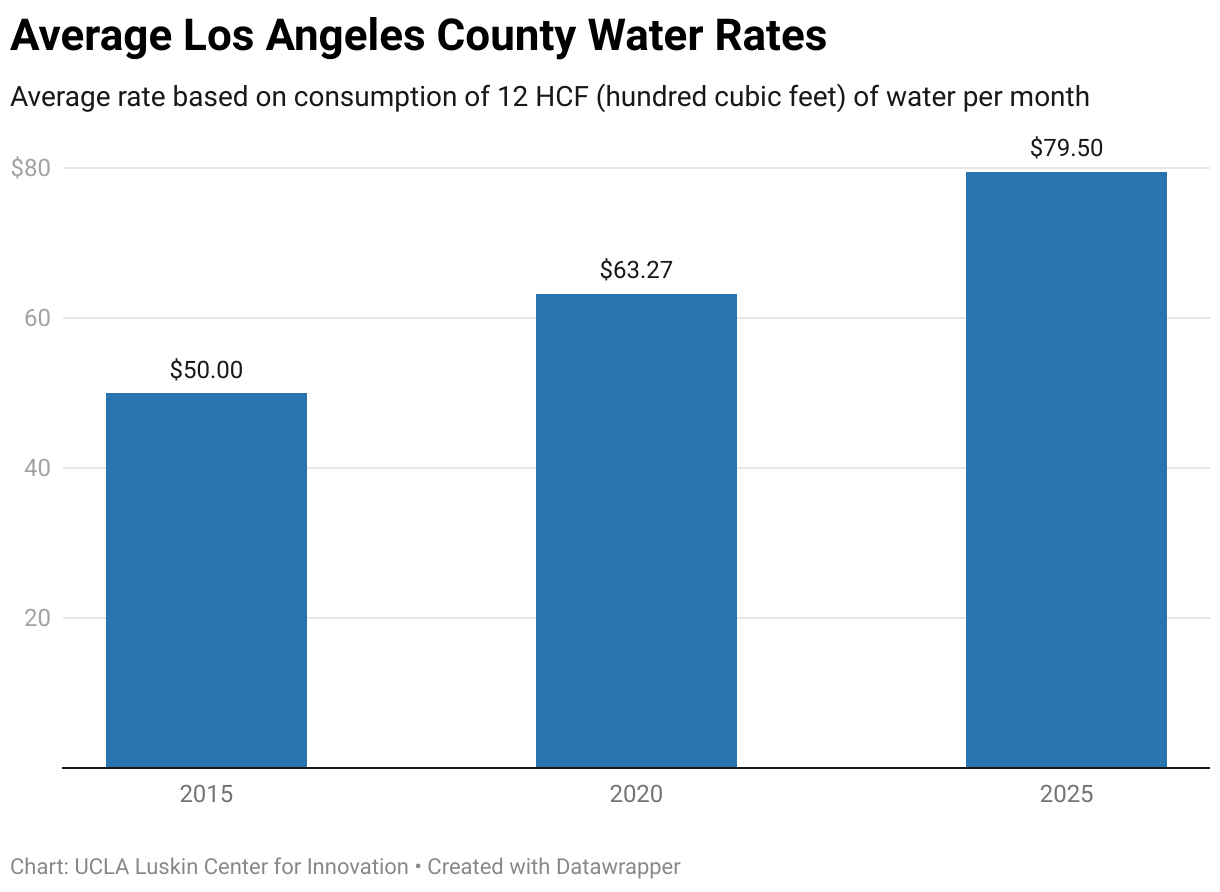
Average household water bills in Los Angeles County climbed 60 percent from 2015 to 2025, rising faster than inflation. Disadvantaged communities often pay as much or more than wealthier neighbors.
"This Atlas provides a baseline that communities and policymakers can use to strengthen oversight, target investments, and ensure progress toward California's Human Right to Water," Pierce said.
A tool for action
As California faces mounting affordability pressures, climate extremes and water quality challenges, the Atlas offers an unparalleled baseline and interactive map to track system performance. By making governance and outcomes transparent, it equips policymakers, water managers, researchers and community advocates to target solutions — from consolidation to conservation — and advance the Human Right to Water.
Learn more about our water research.


