Migrant arrivals were provisionally estimated at 153,100 (± 1,600) and migrant departures at 91,600 (± 1,200) in the 12 months ended February 2019, Stats NZ said today. This resulted in a provisional estimate of annual net migration of 61,600 (± 1,800).
"Provisional annual net migration of 61,600 in the year ended February 2019 is near the highest reported under the new outcomes-based measure," population insights senior manager Brooke Theyers said.
"However, net migration data is subject to revision under the new outcomes-based measure, and revisions may be significant in the first few months after initial release."
That means net migration data is most valuable when put in the context of a longer time series.
"Annual arrival and departure data become subject to less revision four or five months after the figures are first published," Mrs Theyers said.
"We encourage data users to look at both the latest available figures and annual net migration from a few months earlier, for example the 52,200 annual net migration in the year ended September 2018."
See the section below for a discussion of the September 2018 estimates.
In the year ended February 2019, 38 percent of migrant arrivals were citizens of Asian countries and 34 percent were citizens of countries in Oceania (New Zealand, Australia, and Pacific countries). Over the same period, 55 percent of migrant departures were citizens of Oceania and 24 percent were citizens of Asia. New Zealand citizens were the largest group for both arrivals (24 percent) and departures (48 percent).
Year ended September 2018 - how estimates become more certain over time
With each extra month of data, the migration estimation model has more information about the border crossings it is trying to estimate. An example of this is the third revision to migration estimates for the year ended September 2018.
"We can classify most border crossings as short-term or long-term after four or five months," Mrs Theyers said.
"As a result, the provisional estimates published today for the year ended September 2018 are less variable and have more certainty than when they were first released in January."
The provisional estimate of net migration for the year ended September 2018 is 52,200 (± 700). Migrant arrivals are provisionally estimated at 144,100 (± 600) and migrant departures at 91,900 (± 500).
These compare with an estimated 141,200 (± 900) migrant arrivals and 95,900 (± 900) migrant departures when first published in January 2019. Net migration was estimated at 45,300 (± 1,100).
This means migrant arrivals were higher than first estimates, and departures were lower. Consequently, the revised provisional net migration for the year ended September 2018 was 6,600 higher than first estimates indicated.
By the second revision of data, published last month, estimates of migrant arrivals were similar to the revised data published today, while migrant departures were only slightly higher. As a result, there was a small upward change to estimated net migration.
New Zealand and non-New Zealand citizens
In the year ended September 2018, New Zealand citizens accounted for 25 percent of migrant arrivals and 46 percent of migrant departures.
Text alternative for diagram, Estimated migration (mean estimate), year ended September 2018
Revisions to previous estimates
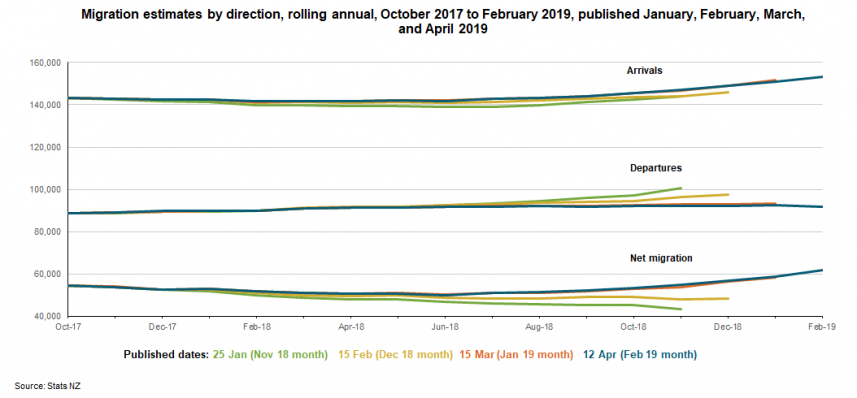
The graph below shows rolling annual migration estimates for migrant arrivals, migrant departures, and net migration, from October 2017 to February 2019. It illustrates how the level of change to migration estimates reduces over the months after the first release.
The arrival and departure estimates become more certain after each subsequent month, and especially after four to five months. Stats NZ is aware that the scale of early revisions to provisional migration estimates have surprised some customers. Current work to provide more information about the new migration estimates includes:
- extending the new migration estimates back to the early 2000s
- analysis of revisions over this extended period to better understand revision patterns
- derivation and release of travel and migration data for subnational areas
- deriving 'credible intervals' which are wider than the currently published 'confidence intervals', to better indicate future revisions to provisional estimates.
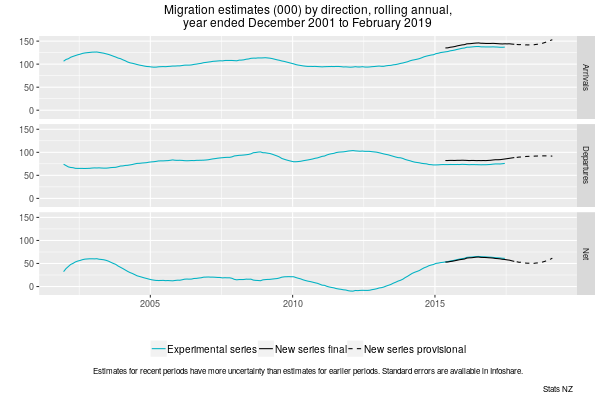
Text alternative for graph, Migration estimates (thousands) by direction, rolling annual, year ended December 2001 to February 2019
Three time-series line graphs show migration estimates for migrant arrivals, migrant departures, and net migration, from rolling annual years ended December 2001 to February 2019 - for experimental series and new series. The graphs show final estimates from May 2015 to October 2017, and provisional estimates from November 2017 to February 2019, for the new series outcomes-based measure of migration. An experimental outcomes-based series for December 2001 to June 2017 gives a longer time series. The new series follows from the experimental series and shows similar ups and downs for migrant arrivals, migrant departures, and net migration.
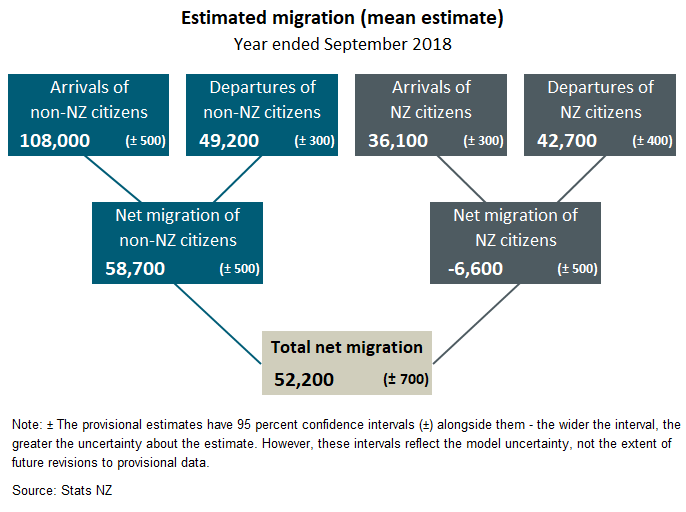
Text alternative for diagram, Estimated migration (mean estimate), year ended September 2018
Diagram shows migration estimates for migrant arrivals, migrant departures, and net migration, for the year ended September 2018. Arrivals of non-NZ citizens were 108,000 (± 500) and departures were 49,200 (± 300), making a net migration gain of 58,700 (± 500) non-NZ citizens. Arrivals of NZ citizens were 36,100 (± 300) and departures were 42,700 (± 400), making a net migration loss of 6,600 (± 500) NZ citizens. Result is a total net migration gain of 52,200 (± 700). Note: ± The provisional estimates have 95 percent confidence intervals (±) alongside them - the wider the interval, the greater the uncertainty about the estimate. However, these intervals reflect the model uncertainty, not the extent of future revisions to provisional data.
Text alternative for graph, Migration estimates by direction, rolling annual, October 2017 to February 2019
Time series line graph showing rolling annual migration estimates for migrant arrivals, migrant departures, and net migration, from October 2017 to February 2019. The graph illustrates the impact of revisions on previously published data. Arrivals for the year ended January 2019 have been revised down less than departures compared with the previous published estimates. As a result, the estimated net migration for the year ended January 2019 has been revised up.


