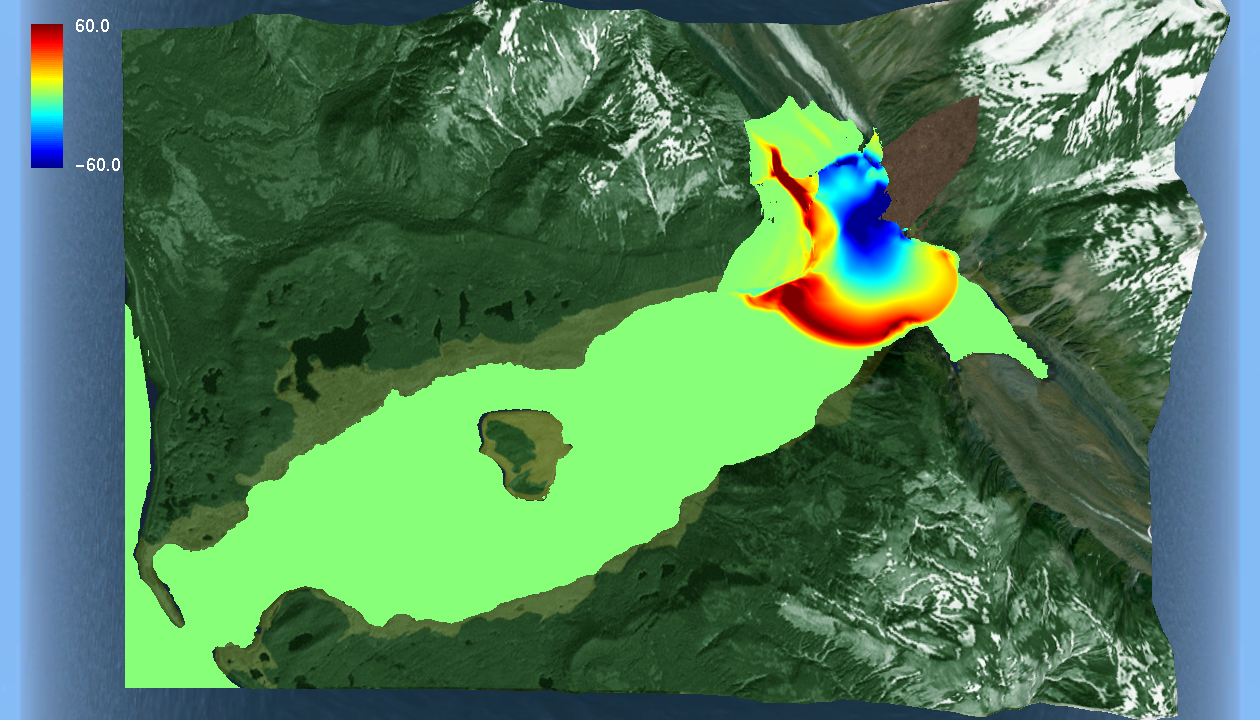
It doesn't have to be a hurricane or a tsunami - even a simple running water tap induces a shock wave upon impact with the sink. Now, with the help of CSCS's supercomputer "Piz Daint", mathematician Siddhartha Mishra of ETH Zürich is working to overcome current barriers to simulating and comprehending highly turbulent flows.

Be it avalanches, tornados, floods, or the air streams carrying an aircraft: Fluid flows are all around us. And sometimes, these flows are highly turbulent and powerful. "To be able to understand their nature is crucial for many technical processes and for predicting natural phenomena," says Siddhartha Mishra, a professor of applied mathematics at ETH Zürich. Mishra is most interested in powerful phenomena involving high turbulences and shock waves - such as the shock unleashed by an explosive, or when an aircraft surpasses the speed of sound to create a sonic boom. Together with his team, he investigates such fluid flows and develops algorithms to represent them more accurately and efficiently in supercomputer simulations. But more importantly, the mathematician seeks to expand the fundamental limits of current fluid dynamics simulations.
The complexity of simple equations
In fact, the equations describing fluids have been known for a while: They were first formulated almost 270 years ago by the Swiss mathematician Leonhard Euler. He did not yet consider the viscosity of a fluid, but nevertheless, his partial differential equations can still be applied for many flows in which the viscosity is negligible. The equations look simple enough on paper, but they are incredibly hard to solve since the phenomena they describe are so complex. "We are yet to fully understand them even today," says Mishra.
Until now, fluid dynamics specialists virtually work around these lingering gaps in understanding. They run algorithms on supercomputers to calculate approximations of the equations' solutions using numerical methods. Indeed, this approach has been highly successful: It has been used to better understand processes like the flight of an aircraft or the flow of liquids through turbines, as well as to predict meteorological phenomena. Mishra's team specifically has, among other things, contributed improved algorithms to simulate and predict external pagetsunamis and avalanches, and also to external pagemodel supernovas.
However, these methods are not strictly mathematically accurate. And, in some cases, they have reached a limit. "Normally, you would expect that, if you increase the resolution of a calculation, the results become more accurate," says Mishra. In other words, including more points in time and space to reduce error should improve the approximations and closer represent reality. But this is not the case when it comes to highly turbulent fluids, as Mishra demonstrated. On the contrary: The results obtained at very high resolution do not relate to the lower resolution results at all - rather than converge, they become unrecognisable. "Which also means that you cannot calculate any predictions for the quantities anymore," explains the mathematician.
Random perturbations are useful
Mishra and his team have been working on a way to overcome this limitation when dealing some highly turbulent fluids by using so-called statistical solutions. For this, they first randomized the problem by introducing many tiny perturbations into the flows being investigated, and then they analysed the averaged outcome. As the scientists discovered, these averages indeed do converge with higher resolution. "This is the basis of statistical solutions," explains Mishra. "If individual realizations of experiments do not converge, you look at averages of these quantities instead. These then begin to get more and more convergent." Simply put: "When representing turbulent flows, it's the details that destroy you. That's why with averages you start to see more structure." This effect not only applies to a quantity itself, like density, but also to its variance and its probability distribution, as Mishras group has established.
To make matters even more complex, one must also consider that the statistical properties of flows, at different points in space, are not independent from each other. For instance, in meteorology, the temperature in Zürich not only affects nearby sites but also sites far away, like the temperature in Munich. "That's why instead of examining single points, we have to take into account correlations between points," says Mishra. "And since we are talking about complex non-linear problems, these multi-point correlations become extremely complicated."
Solving turbulent and explosive problems
So, what about proof of the theory? "We don't have a comprehensive theorem yet, but we can compute such statistical solutions," says Mishra. "So far, every test prediction we have made with 2-D flows has checked out." Be it mean values, variance, probability distribution, correlations, functions - as the resolution converges, all statistics converge too, and the solutions obtained are stable.
-
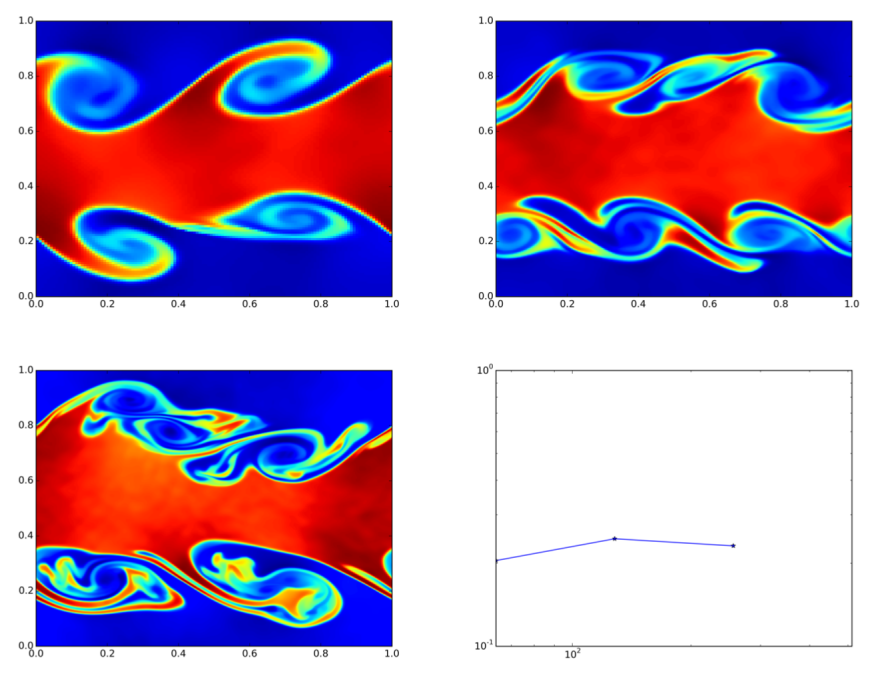
The image shows a comparison of the densities of a turbulent fluid flow calculated with varying resolution, from a 128-point grid (upper left) to a 512-point grid (lower left). The error, however, does not decrease with increased resolution (graph lower right), and the results do not converge. (Illustration: S. Mishra) -
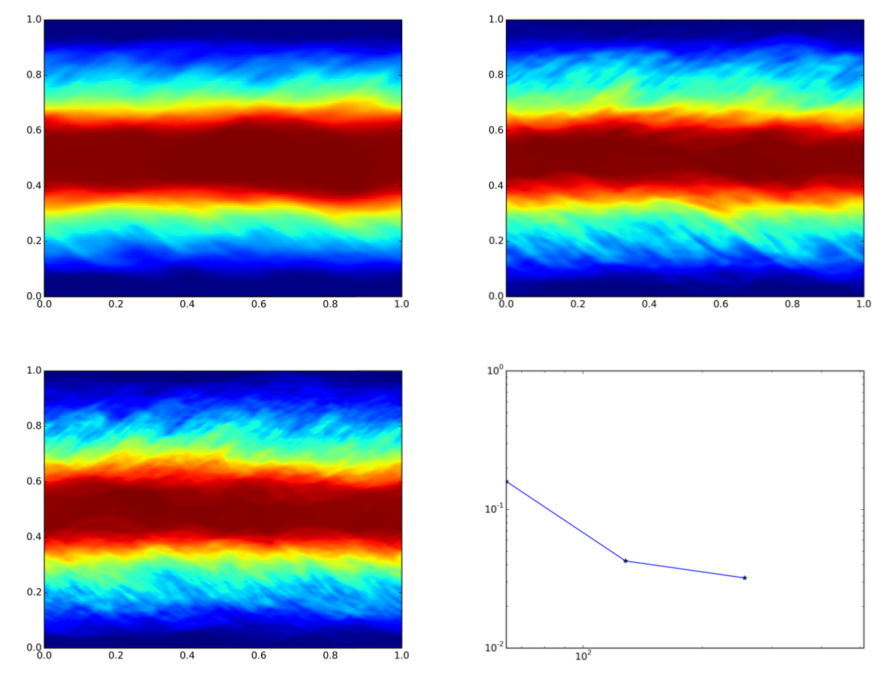
The problem is solved if randomized perturbed ensembles are used. Shown here are the flow densities of a 64-ensemble. Already, the error decreases with higher spatial and temporal resolution, and the results converge. (Illustration: S. Mishra)

Following the calculations in 2-D, Mishra's team performed 3-D simulations on "Piz Daint". However, the 3-D computations were much more expensive: Initially, a single ensemble run with a point grid size of 1024x1024x1024 took 3000 node hours of runtime, which corresponds to a cost of 1.5 million U.S. dollars. More recently, the scientists optimized their code to efficiently use "Piz Daint's" GPUs. With this, they sped up calculations more than tenfold, reducing the runtime to around 250 node hours.
In the simulation experiments, the fluids were first virtually contained in a tube, on which shearing forces were applied to mimic the origin of so-called Kevin-Helmholz instabilities. These instabilities result in specific turbulent eddies, such as in the curling smoke of a candle, certain cloud formations, or gas formations in the atmospheres of planets. Again, the results demonstrated that just looking at individual simulations shows is no convergence. "But when you work with the statistical properties of numerous simulations, such as mean values, variance and probabilities, the solutions converge," confirms Mishra.
-
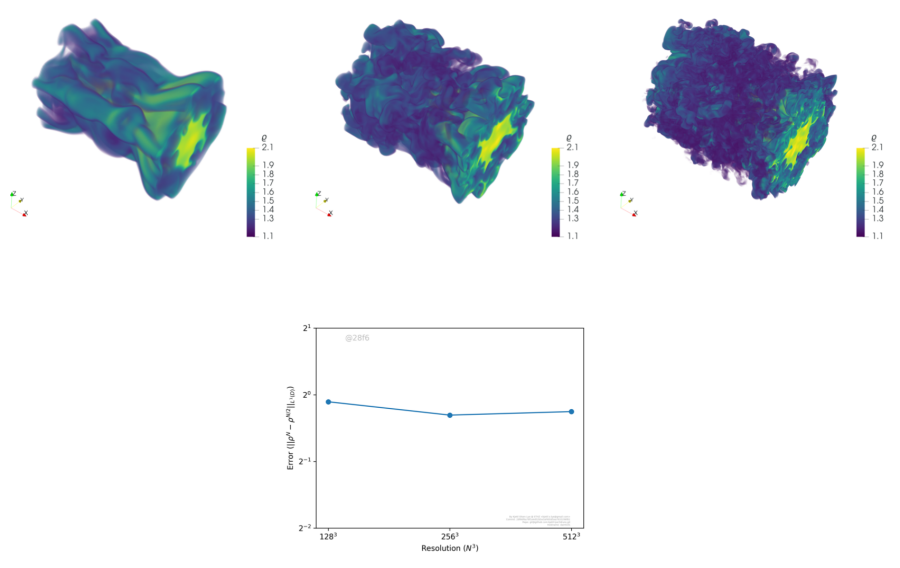
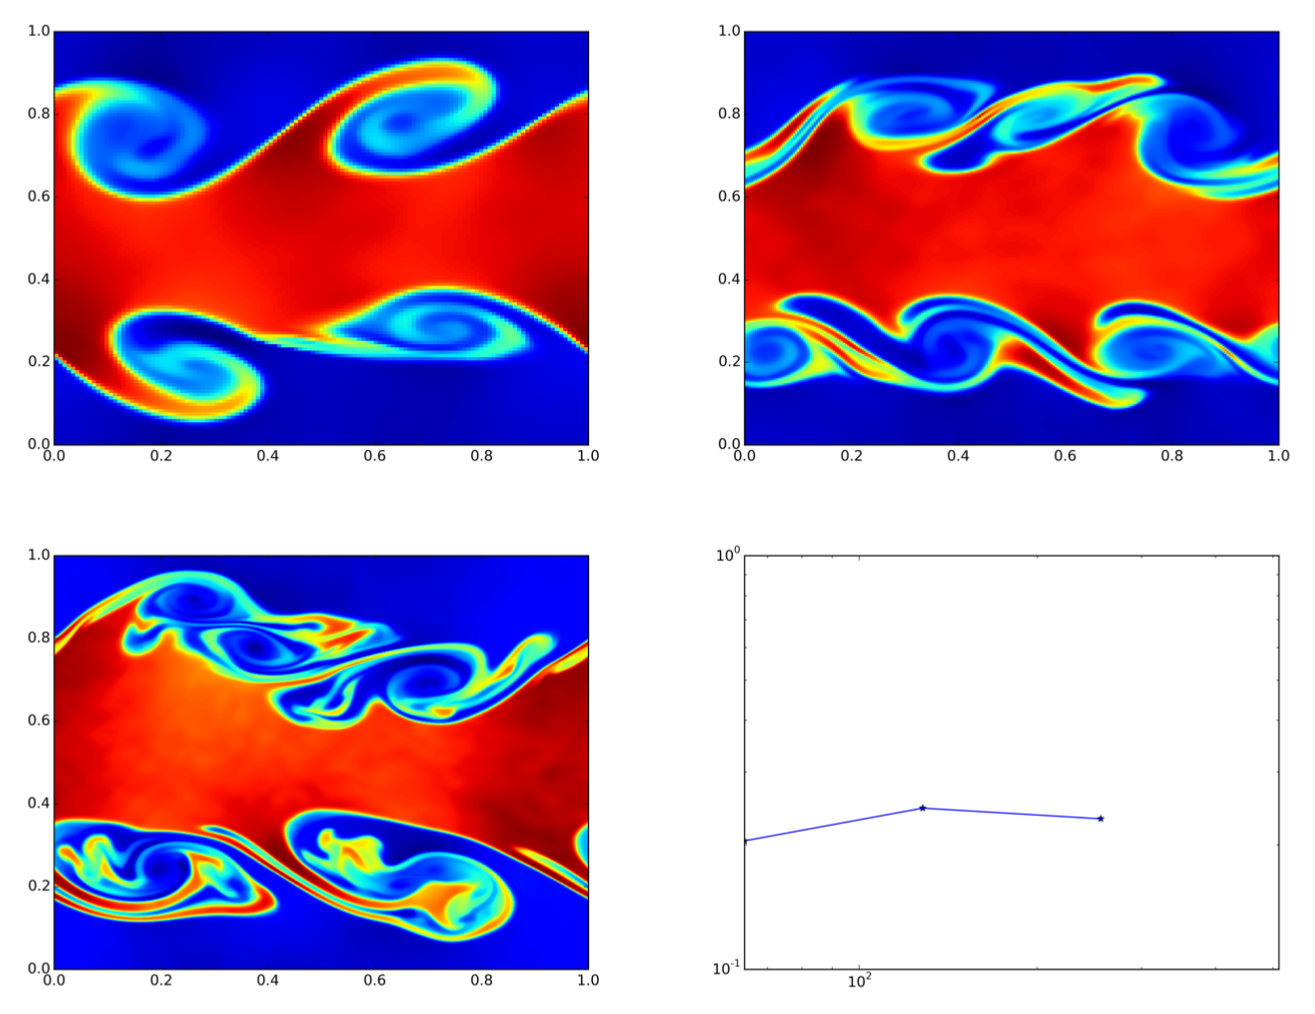
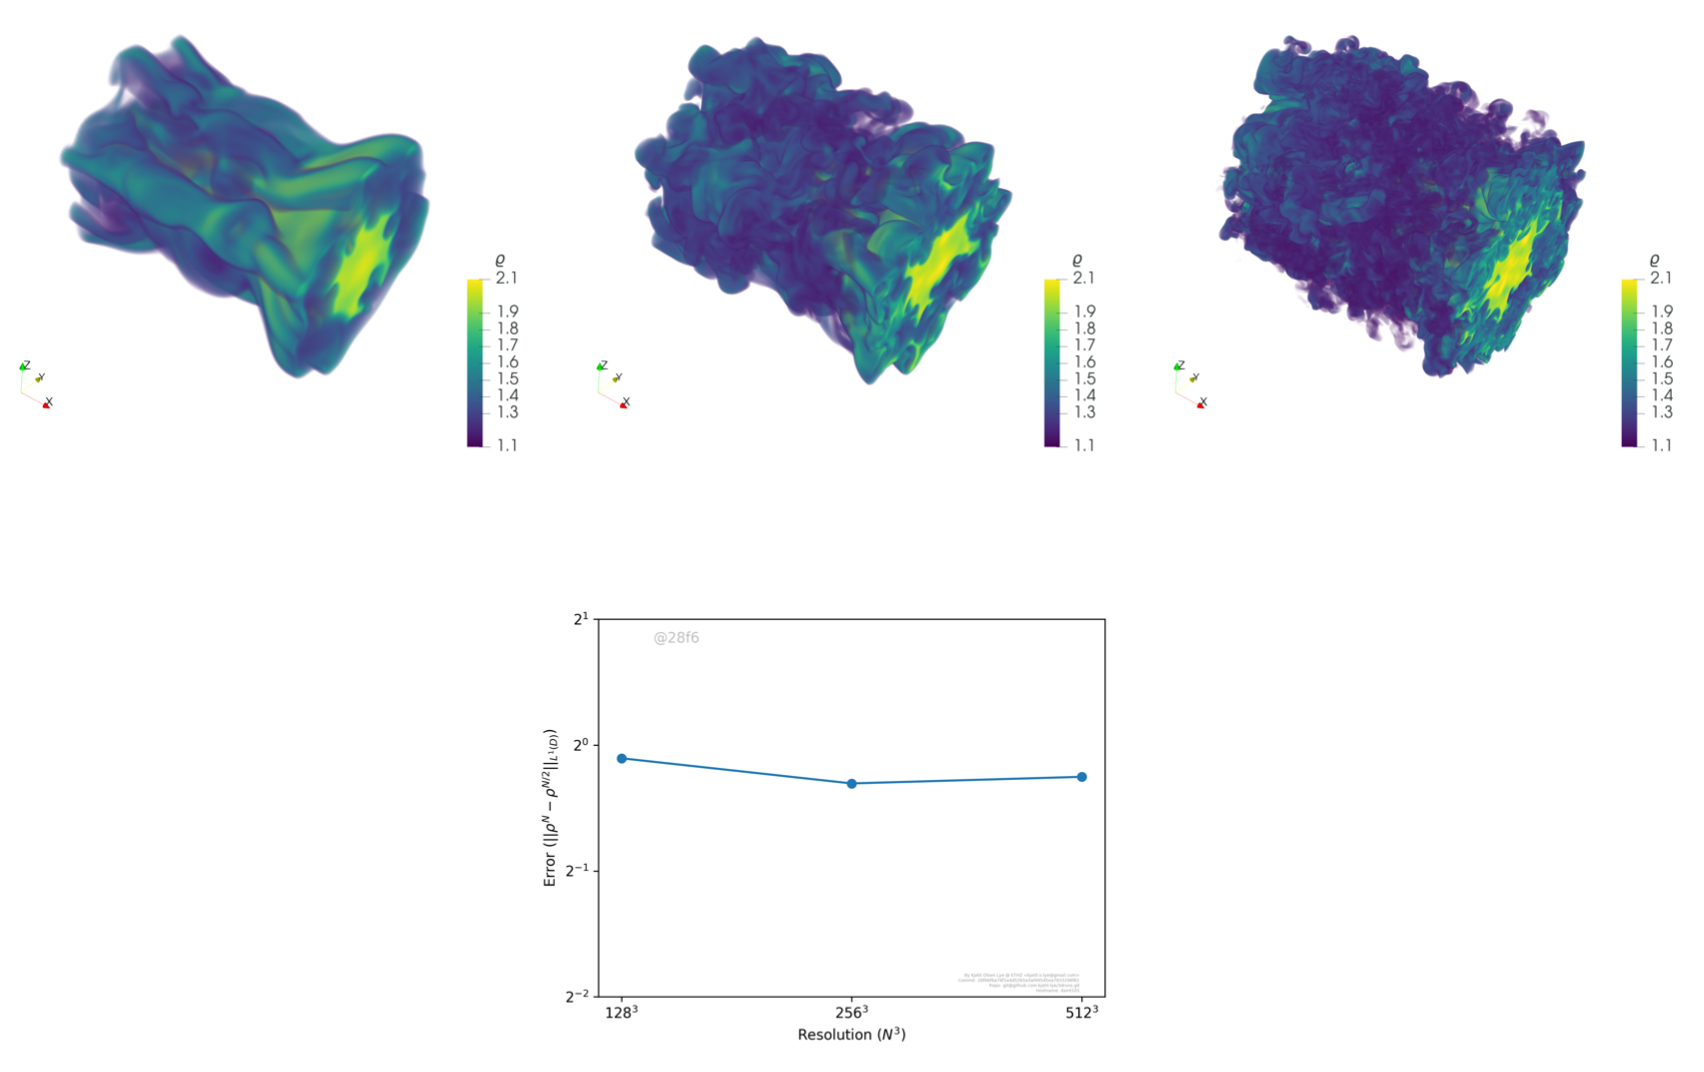
The image shows individual 3-D-simulations of a flow subjected to shearing forces. This is to mimic Kevin-Helmholz instabilities at resolutions of (from left to right) 128^3, 256^3 and 512^3 grid points. Again, the results do not gain in accuracy with increasing resolution. (Illustration: S. Mishra) -
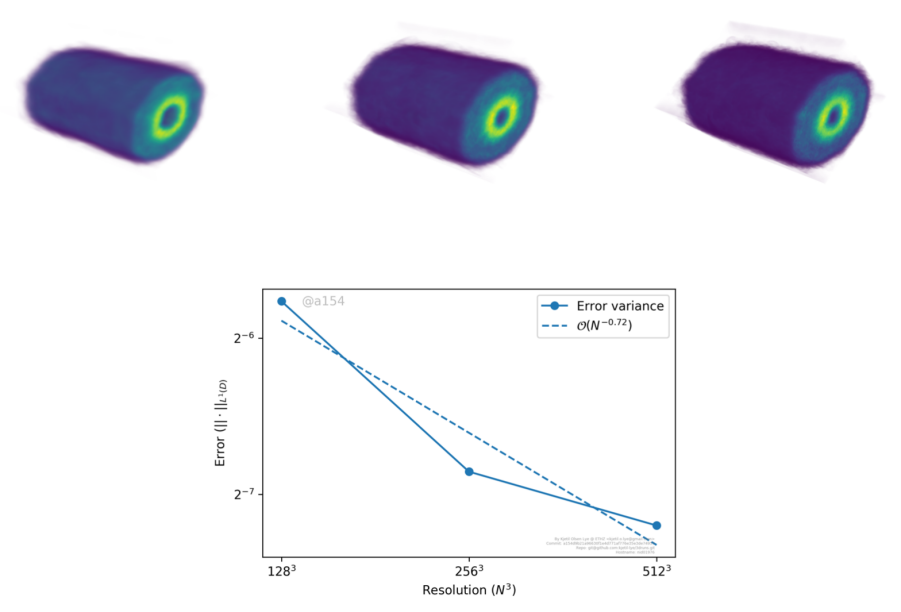
Things are different when analysing the statics of the simulations. Now, mean values, probability distributions, and error variances - as shown in the image - converge with increasing resolution and improve the outcome. (Illustration: S. Mishra)

From hypothesis to experiment to theorem
His group recently performed similar simulations of another phenomenon, the so-called Richtmeyer-Meshkov instability, on "Piz Daint". This is a common instability in astrophysics and occurs when a shock wave hits an interface of different fluids. "It's a violent phenomenon, similar to an explosion," explains Mishra. The team's simulations and analyses showed, again, that statistical solutions of many simulations yielded convergence with increasing resolution, while individual simulations did not.
"Computationally, we mostly understand what is going on," Mishra sums up. "We have verified our hypothesis on the usefulness of statistical solutions experimentally, which has helped us build a lot of intuition. But now we must switch to pen and paper to rigorously prove the mathematics of our hypothesis and establish a theorem based on the fundamental axioms of mathematics." For a mathematician like Mishra, this is imperative: the ultimate level of truth.
References
S. Lanthaler, S. Mishra and C. Parés-Pulido: Statistical solutions of the incompressible Euler equations, Math. Mod. Meth. Appl. Sci. 31 223-292 (2021), DOI: external page10.1142/S0218202521500068
U.S. Fjordholm, K. Lye, S. Mishra and F. Weber: Statistical solutions of hyperbolic systems of conservation laws: Numerical approximation, Math. Mod. Meth. Appl. Sci. 30 (3) 539-609 (2020), DOI: external page10.1142/S0218202520500141
K.O. Lye, Computation of statistical solutions of hyperbolic systems of conservation laws, 2020, ETH dissertation no. 26728


