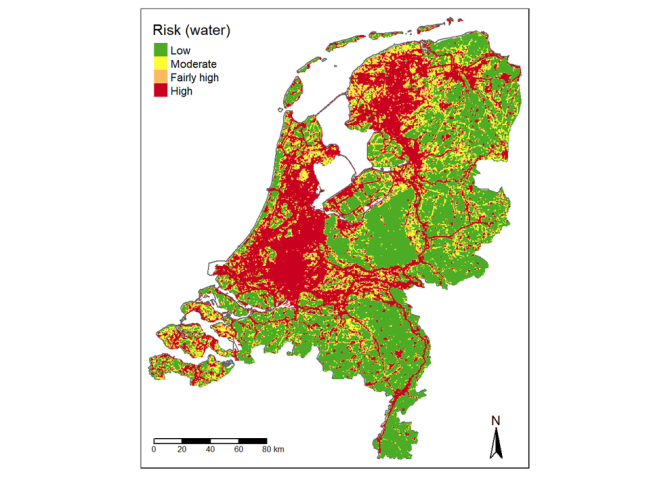
Researcher José Gonzales of Wageningen Bioveterinary Research (WBVR, part of Wageningen University & Research), together with colleagues, mapped water and forest environments of poultry farms in relation to bird flu infection. Area maps were developed using this research. "These area maps show the likelihood of bird flu infection based on the proximity to and the amount of water, forest and trees in the immediate vicinity of poultry farms," Gonzales says.
Commissioned by the Ministry of Agriculture, Nature and Food Quality (LNV), Wageningen Bioveterinary Research (WBVR) mapped the bird flu infection risk around poultry farms based on the proximity and amount of water and forest/trees. José Gonzales and his colleagues used data from infected and non-infected poultry farms in the period 2014-2022 for this purpose. In addition, the method can also be used to estimate bird flu infection risk for locations where no poultry farm is yet present. This can be helpful when starting a new poultry farm or moving existing poultry farms to a new location.
Recent research by WBVR in Lelystad revealed several risk factors that influence the likelihood of highly pathogenic avian influenza (HPAI) infection of commercial poultry. These include (combinations of) farm types and landscape variables. In various policy processes, such as the intensification plan for the prevention of avian influenza and the so called accompanying structuring choice animal diseases and zoonoses within the National Rural Area Programme (NPLG), attention is paid to these risk factors in relation to HPAI infection risk.
Landscape variables
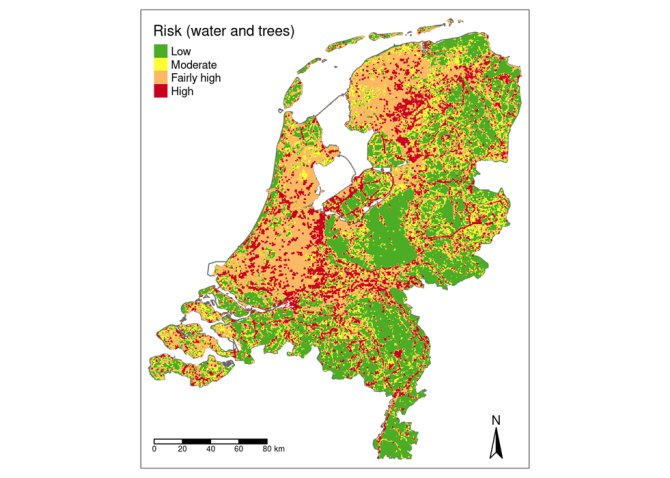
Important landscape variables around poultry farms which do not change much over time, are proximity to and amount of water (associated with increased risk), and proximity to and area of forest/trees (associated with decreased risk). To take these risk factors into account, it is necessary to be able to identify when a poultry farm site is water-rich and/or forest/tree-rich.
Risicokaarten
Two models have therefore been developed: a basic model based only on water area within 500 m of a poultry farm and a model combining water area and area of forest and trees within 500 m of a poultry farm. The basic model (water only) produces the risk map shown in Figure 1.
The model combining water and forest and trees is slightly more accurate in identifying areas with avian influenza infection risk than the base model (see Figure 2).
The risk maps created by WBVR can be used to further develop policies and regulations to reduce the risk of HPAI outbreaks in poultry farming. Also, the definition of water and tree/forest environments can be used in the formation of integrated area plns and decision-making processes within the NPLG.


