Key takeaways
- A national Shade Map from the UCLA Luskin Center for Innovation and American Forests maps the shade infrastructure for more than 360 U.S. cities and towns — the first time communities have an accessible way to see how much shade they have, where it is and whether it comes from buildings or vegetation.
- The researchers provide interactive, city-specific stories showing real-world applications, ranging from school routes in Austin to Detroit bus stops and Phoenix parks.
- The tool aims to help federal, state and local decision-makers identify existing "shade deserts" and prioritize investments to mitigate the impacts of extreme heat.
A new tool launched by the UCLA Luskin Center for Innovation and American Forests experts is helping cities across the United States respond to extreme heat by mapping an essential climate solution: shade.
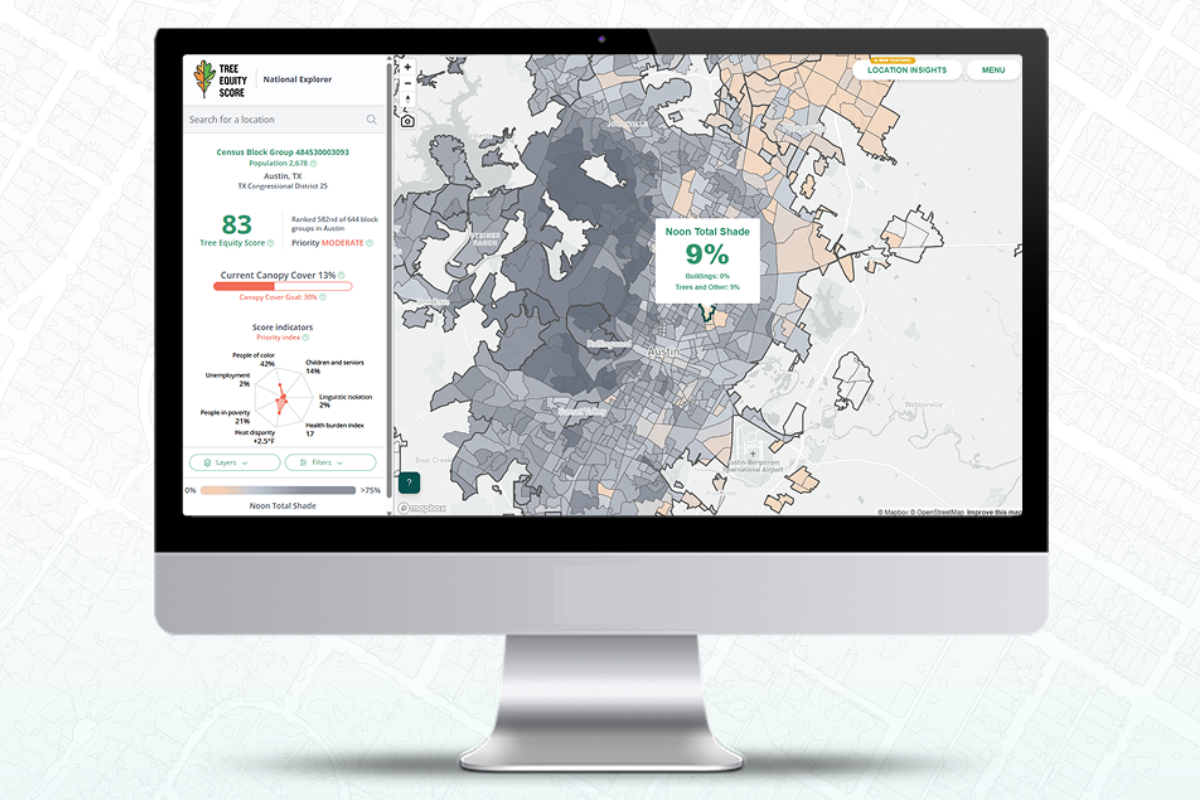
The Shade Map, now available through American Forests' Tree Equity Score platform, shows where shade exists — and where it doesn't — in 101 of the largest urbanized areas in the country, covering more than 360 cities and towns. It visualizes how shade from trees and buildings changes throughout the day, providing decision-makers with data to guide local heat resilience efforts.
"Most cities aren't armed with the data they need to know if there is shade where communities need it most," said V. Kelly Turner, associate director of the UCLA Luskin Center for Innovation. "That's where the Shade Map comes in. Never before has it been this easy for communities in the U.S. to know how much shade they have, where it is and whether the source is buildings or vegetation."
The map reveals widespread "shade deserts" — areas lacking adequate shade infrastructure — throughout virtually all major urban regions in the U.S. With extreme heat contributing to an estimated 12,000 premature deaths each year, the new resource responds to an urgent public health need. It also shows that, at noon, trees provide 25 times more shade than buildings, making them a particularly powerful solution.
By showing shade at noon, 3 p.m. and 6 p.m. — including parcel-level data in select cities — the Shade Map allows civic leaders to identify where investments in natural and engineered shade are most needed.
The researchers explored the role of shade in heat equity planning in three immersive stories as examples of how the tool can be useful:
- In Austin, parents can explore shade coverage on routes to schools and the disparity in shade coverage across the city.
- In Detroit, transit and city planners, as well as transit riders, can explore shade conditions at and near bus stops, where coverage is critical for protecting the 85,000 people who rely on public transit daily.
- In Phoenix, where dangerous heat is a daily reality, city planners and residents can use shade data to guide improvements in public parks, building on the city's Shade Phoenix Plan.
Support for this work was provided by the Robert Wood Johnson Foundation.


