
The first storm warning for the Miami area wasn't issued until only a few hours before the powerful cyclone made landfall just south of downtown, leaving residents with little time to prepare for what would become the hurricane of their nightmares.
When the massive Category 4 storm did strike in the early morning hours of Sept. 18, 1926, it battered the city with 145-mile-per-hour winds, leaving thousands of people homeless and claiming more than 100 lives in the Miami area alone.
"There is nothing like the 1926 hurricane in the historical record for Miami," said Brian McNoldy, a senior research associate and tropical cyclone expert at the University of Miami Rosenstiel School of Marine, Atmospheric, and Earth Science. "It was very intense, very large, and passed directly over downtown. It came at a time when forecasts were primitive, warnings were insufficient and people were inexperienced."
The storm's widespread devastation effectively ended Florida's 1920s land boom and ushered in an early local start to the Great Depression.
While the storm did not permanently cripple the University of Miami, which had been founded in 1925, it did strike a serious blow to the fledgling institution, damaging its early buildings, forcing a temporary halt to campus construction projects and delaying the start of classes.
The University, however, pressed on, opening its doors for classes in late October of that year. And the storm, known as the Great Miami Hurricane of 1926, actually inspired the school's iconic "Hurricanes" nickname.
In what is believed to be a first, McNoldy, using a meticulous reconstruction method of parameters that are not part of the 1926 storm's official historic record, has created a series of new wind field maps for the storm.
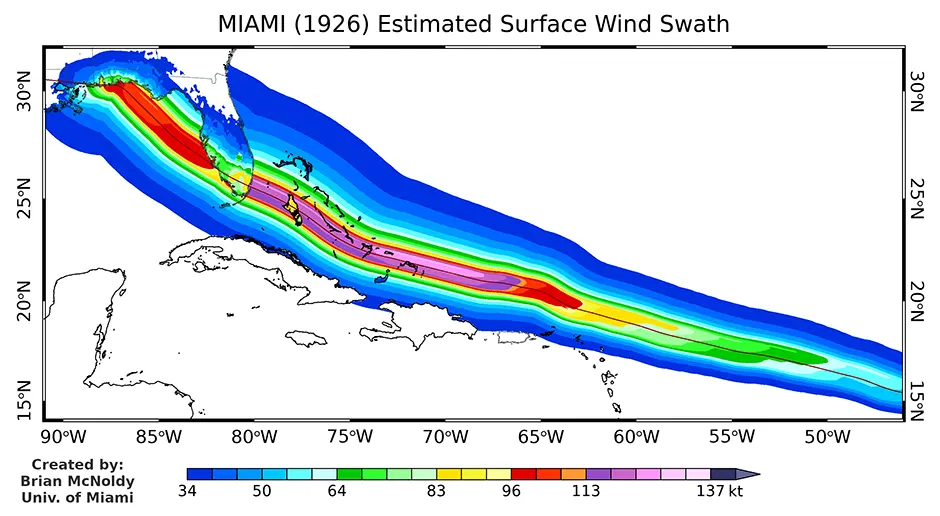 Produced using a parametric model that utilizes observed storm characteristics such as intensity, radius of maximum wind, radii of tropical storm-force wind and track, the maps show a surface wind swath over the hurricane's lifetime. The colors on the maps correspond to the Saffir-Simpson rating system, which classifies hurricanes based on their maximum sustained wind speed.
"Filling in the many gaps began with some estimates of the symmetric extent of the tropical storm winds when environmental surface pressures were known in addition to the storm's central pressure," McNoldy said. "Empirical relationships helped to create some eyewall size estimates. Times with very sparse data were carefully blended between times with better estimates, and asymmetries were introduced based on the storm's forward speed, direction and latitude."
He collaborated with John Knaff, a National Oceanic and Atmospheric Administration (NOAA) meteorologist whom he has known for nearly 30 years and is an expert in tropical cyclone size estimation.
"To my knowledge, this is the first visualization of the 1926 storm's entire wind field over its lifetime," McNoldy said. "The new information is a best-guess of the quadrant-specific extent of tropical storm-force winds and the eyewall size every six hours for 11 days. Recognizing the uncertainties surrounding the storm size estimates, it fits our sparse observations rather well. By all accounts, this hurricane was very large, in contrast to something like Hurricane Andrew, which was extremely small."
 A high-resolution dataset of a parameter called "roughness length," created by David Nolan, a professor in the Rosenstiel School's Department of Atmospheric Sciences, was critical to the successful completion of the maps.
"The issue has to do with how hurricane wind speeds change over land," Nolan explained. "The wind speeds we hear on TV and on the internet are calibrated for over the ocean, where the surface is fairly smooth compared to land surfaces. As hurricanes move over land, the wind near the ground is reduced substantially. So, I provided Brian with a formula to convert the over-ocean wind speeds to something more accurate over land."
Nolan's formula requires an estimate of how rough the surface is based on the type of land, such as farmland, suburban homes, thick trees or tall buildings. "I created a dataset using modern land use information, but then we arbitrarily reduced the roughness parameter substantially in urban areas because tall and large buildings did not exist in Miami back in 1926," Nolan said. "It's not perfect, but it's much better than using ocean wind speeds and also much better than using the roughness of the modern era."
McNoldy's maps are not part of NOAA's Atlantic Hurricane Database Reanalysis Project, an ongoing effort to correct errors, remove biases and uncover undocumented storms in the official North Atlantic hurricane database.
"Hurricane reanalysis is important for several related reasons," said Rosenstiel School professor of atmospheric sciences Sharan Majumdar. "It allows us to continue to advance our understanding of hurricane structure and impacts, to identify any variability in hurricane activity across prior years and decades, and to learn lessons from previous storms such as the 1926 hurricane to build a society and infrastructure that are more resilient to future hurricanes."
So, just how helpful McNoldy's new wind field maps will be is still to be determined. "I can provide the edited storm data file to the National Hurricane Center for consideration, and perhaps the historical record of the storm could eventually be updated with the new values," he said.
What is clear is that the project, done out of what McNoldy calls "a desire to create something new and as realistic as possible for the storm's historic landfall centennial," could generate renewed conversation on the impact of the 1926 storm and how forecasting has improved in its aftermath.
"Advances in hurricane forecasting over the past century are immeasurable," McNoldy said. "In 1926, aircraft reconnaissance of hurricanes was 20 years away, computer modeling capable of forecasting hurricanes was 30 years away, and routine weather satellite coverage was 50 years away. Forecasts relied on sparse observations far away that suggested where a storm might be and perhaps a crude estimate of its intensity. The future track of the storm would have been deduced from large-scale weather patterns, with enormous errors. Intensity forecasting as we know it today did not come into existence until the 1990s."
Just how powerful was the Great Miami Hurricane of 1926? Using data collected from Hurricane Hunter reconnaissance flights, satellites and computer weather models, researchers can measure the overall destructive potential of a hurricane—a scientific metric called its "integrated kinetic energy," or IKE, which is measured in units of energy called terajoules (TJ).
While such scientific instruments did not exist when the 1926 cyclone hit, by McNoldy's best estimates, the 1926 storm packed approximately six times more energy (170 TJ) than Hurricane King (30 TJ) in 1950 and four times more than 1992's Andrew (43 TJ) at their landfalls in southeast Florida. "To put terajoules into perspective, the Hiroshima atomic bomb released about 63 terajoules of energy," explained McNoldy, noting that the values he referenced for the hurricanes were at the moment of landfall and only for the surface winds.
While a storm of similar size and intensity making a direct hit on the modern Miami of today would very likely result in catastrophic damage, "there would also be an unprecedented evacuation ahead of it to minimize the loss of life," McNoldy said.
And in its aftermath, lessons learned and perhaps a new way of building.
"Each of the major hurricanes—whether it's the 1926 storm, Hurricane Andrew most certainly, Hurricane Katrina, or superstorm Sandy hitting the Northeast—are events that tested the physical environment," said Denis Hector, an associate professor in the School of Architecture, who initiated the first National Science Foundation Hurricane Hazard Research Conference post-Andrew and participated in the Mississippi Renewal Forum Charrette after Hurricane Katrina.
"We design buildings, structures and cities based on assumptions about the environmental loads and the environmental conditions that they have to withstand," he continued. "And with such natural disasters, the precautions and safety features that we incorporate into buildings is the one time they're actually tested in real-world conditions."
Hector noted that the 1926 hurricane was the impetus for the beginning of the reinforced masonry system of construction that is still in practice today in South Florida. "And Hurricane Andrew directly drove the creation and mandate of modern impact-resistant windows and stricter Florida building codes," he said. "The fabric of the city that experienced Hurricane Andrew is enormously different than the fabric of the city we have today. We have many new high-rise buildings with a lot of glass up in the air that have been built to very thoughtful building codes. How will the city fare when another powerful storm eventually hits? It will be a full-scale test to see how well the code predicts safe behavior."


